Grafana OnCall 是 Grafana Labs 推出的一款开源事件响应与排班调度工具,可以帮助团队管理和跟踪故障处理情况,提高 SRE 团队的工作效率,更快地解决事件。可以自动路由警报到指定的值班团队和 ChatOps 频道,根据预定义的升级策略、时间表和通知偏好进行处理。
Oncall平台一般都要钱购买的,开源的不多,Granfana-Oncall是开源的,但是网上的资料比较少,官网写的也不是很详细,自己摸索了好几天,遇到不少坑。
部署
通过docker-compose部署
docker-compose.yaml:
1 | x-environment: &oncall-environment |
配置环境变量:.env文件:
1 | DOMAIN=http://10.168.2.236:8080 |
Grafana配置文件:grafana.ini文件:
1 | [feature_toggles] |
启动:
1 | docker-compose pull |
启动完成后安装Grafana-oncall插件:
1 | curl -X POST 'http://admin:admin@localhost:3000/api/plugins/grafana-oncall-app/settings' -H "Content-Type: application/json" -d '{"enabled":true, "jsonData":{"stackId":5, "orgId":100, "onCallApiUrl":"http://engine:8080", "grafanaUrl":"http://grafana:3000"}}' |
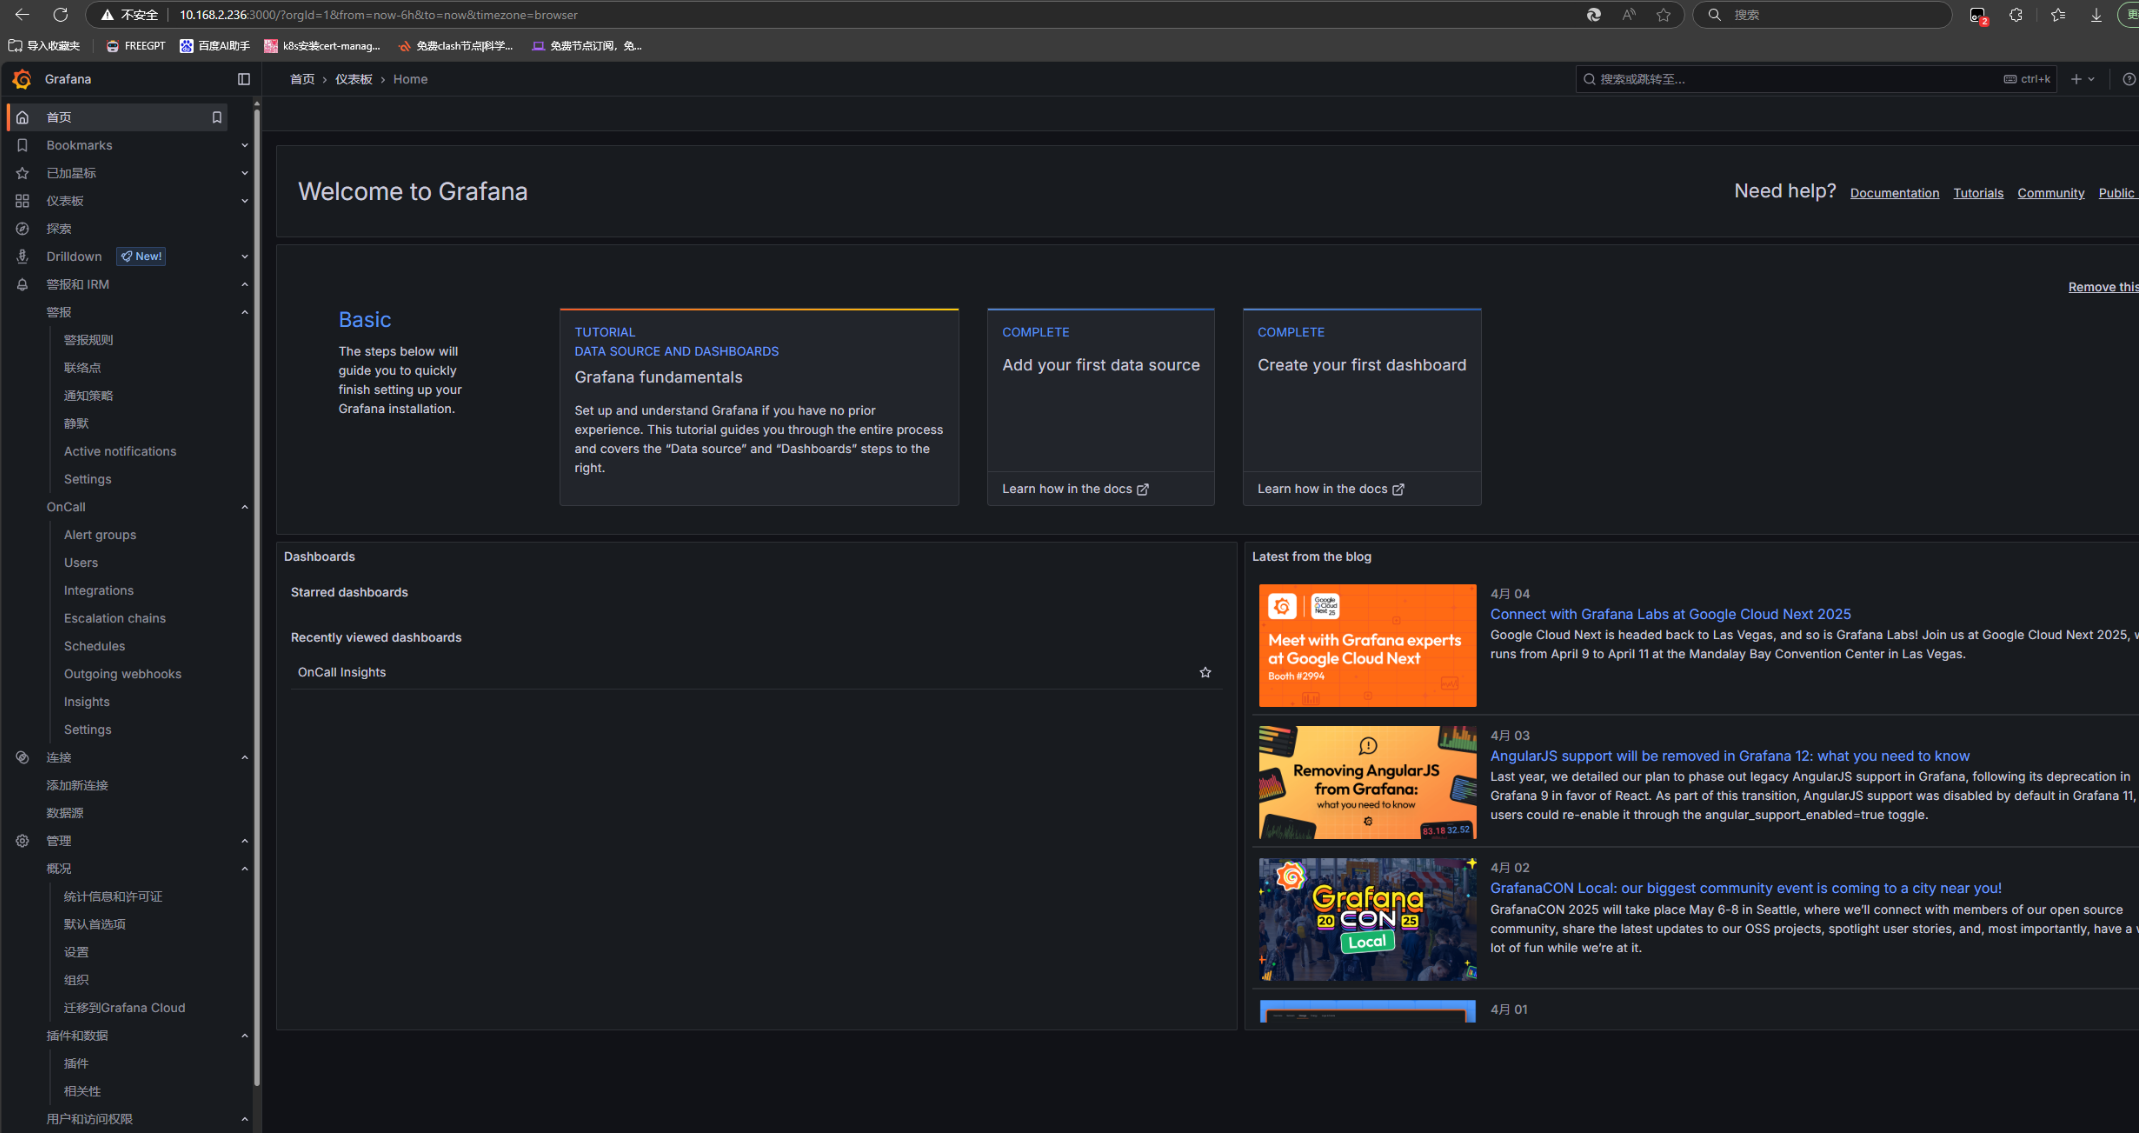
登录:10.168.2.236:3000,账号密码为admin/admin
配置集成:
skywalking的告警通过webhook的类型,Altermanager直接用Altermanager的类型就行:
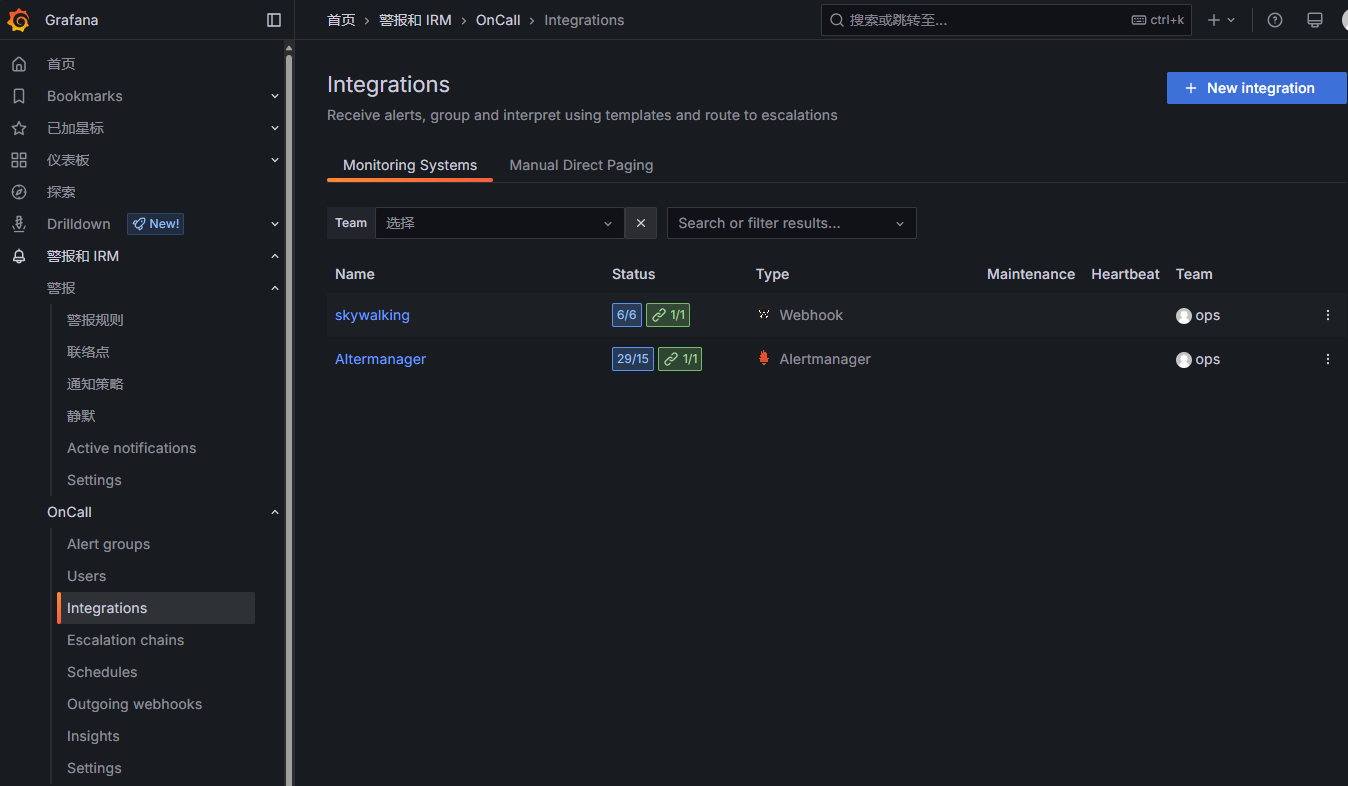
点击集成可以查看对应的Endpoint,配置到对应的skywalking和Altermanager配置文件里:
skywalking:
在alarm-settings.yml文件最后添加
1 | webhooks: |
Altermanager:
alertmanager.yaml文件
1 | global: |
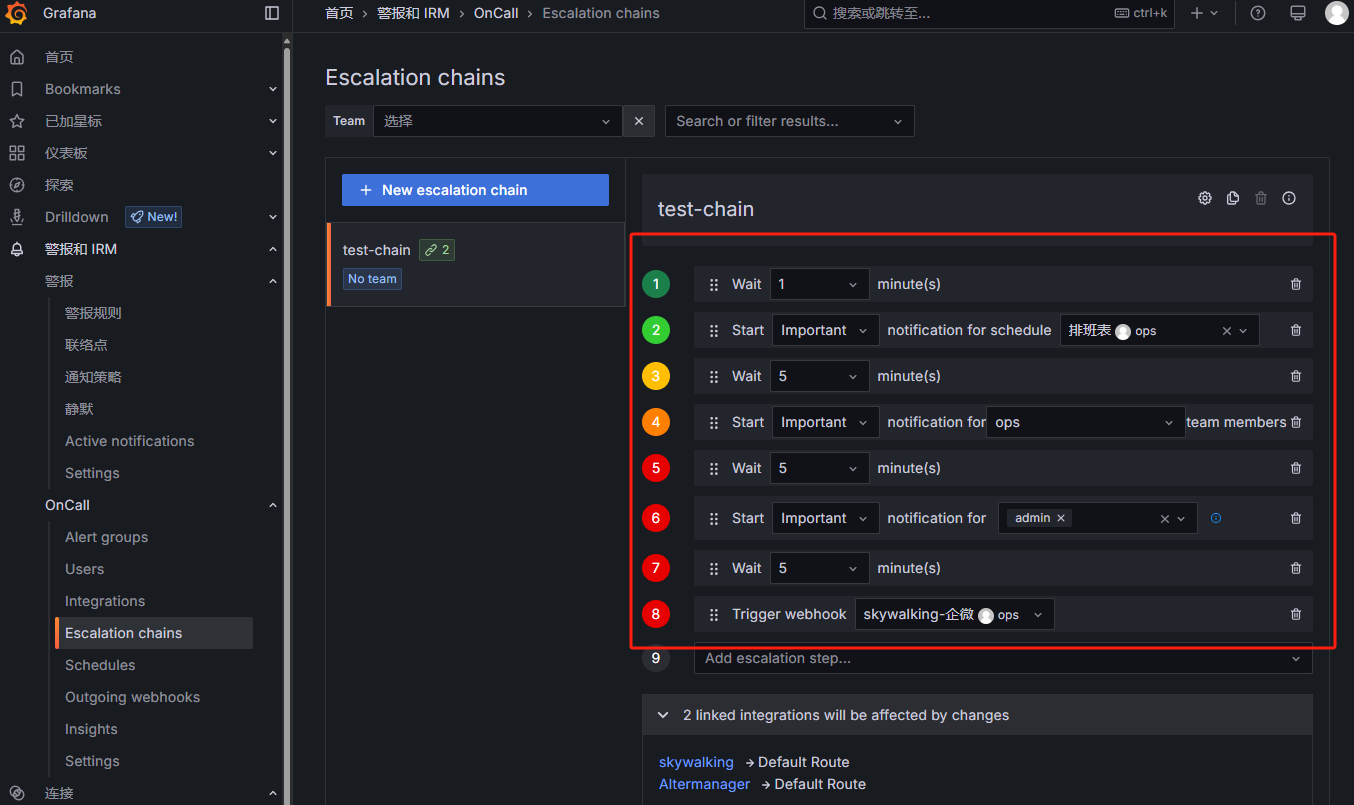
集成配置完之后配置升级链:
触发告警之后执行的步骤:
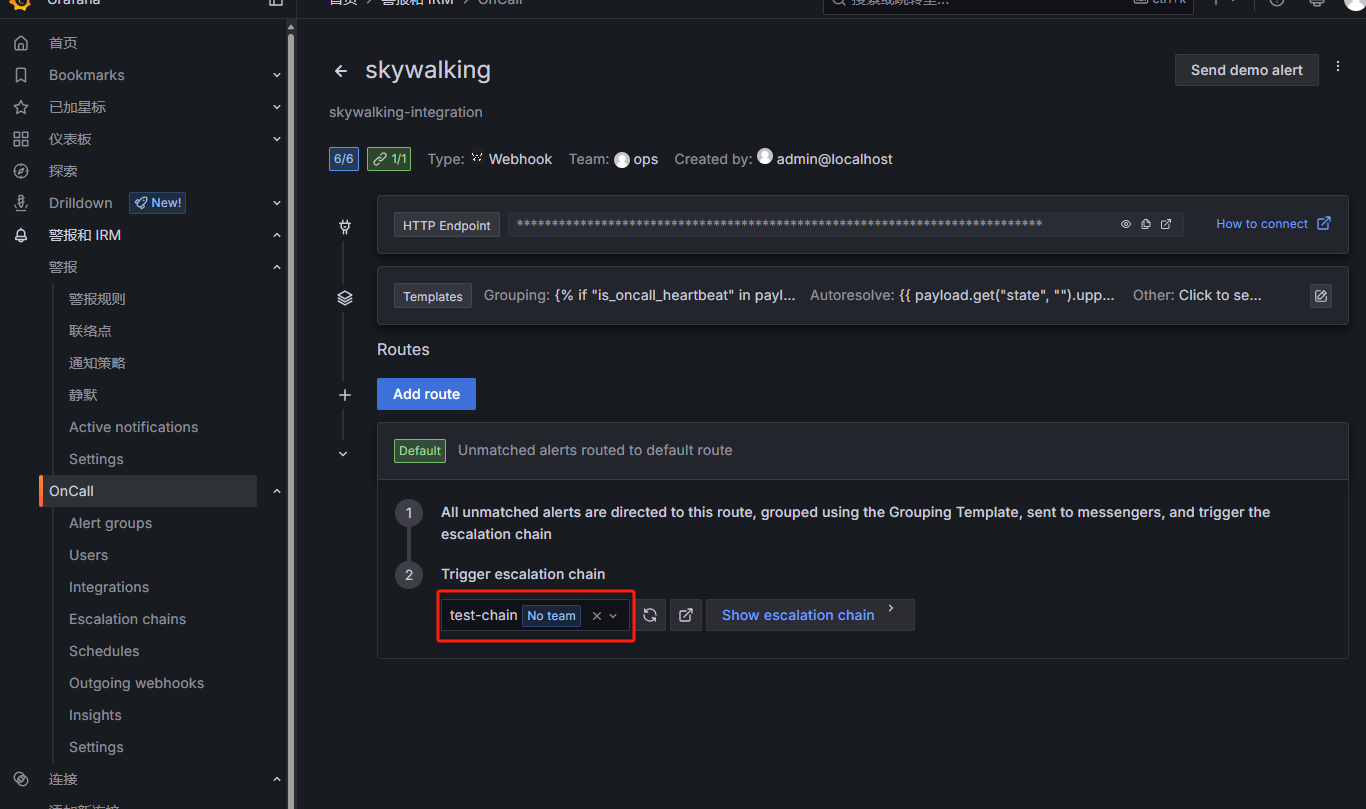
可以在集成详情里引用不同的升级链:
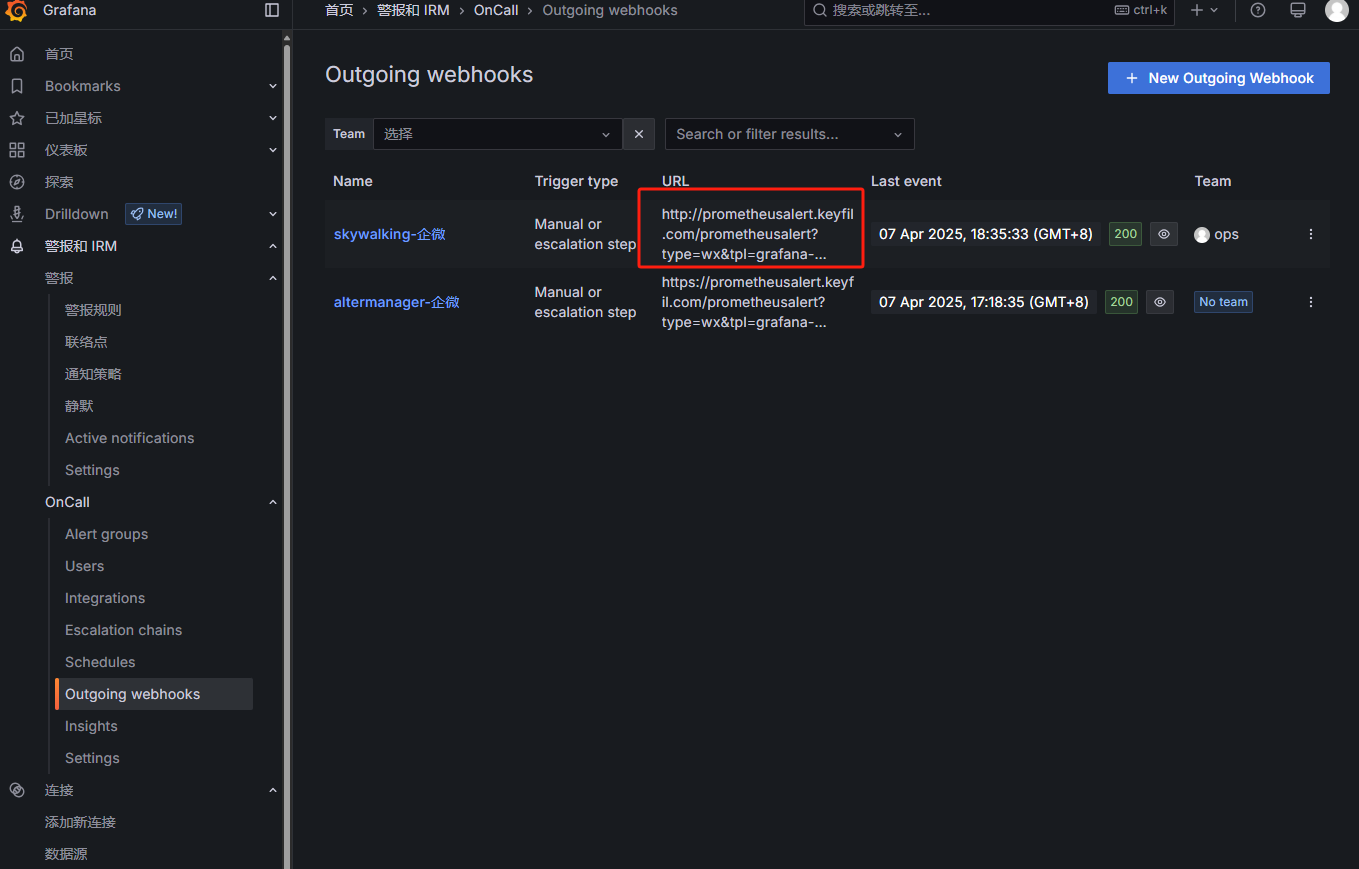
配置Outgoing webhooks:
发送到prometheusalert平台对应的模板,再发送到企微:
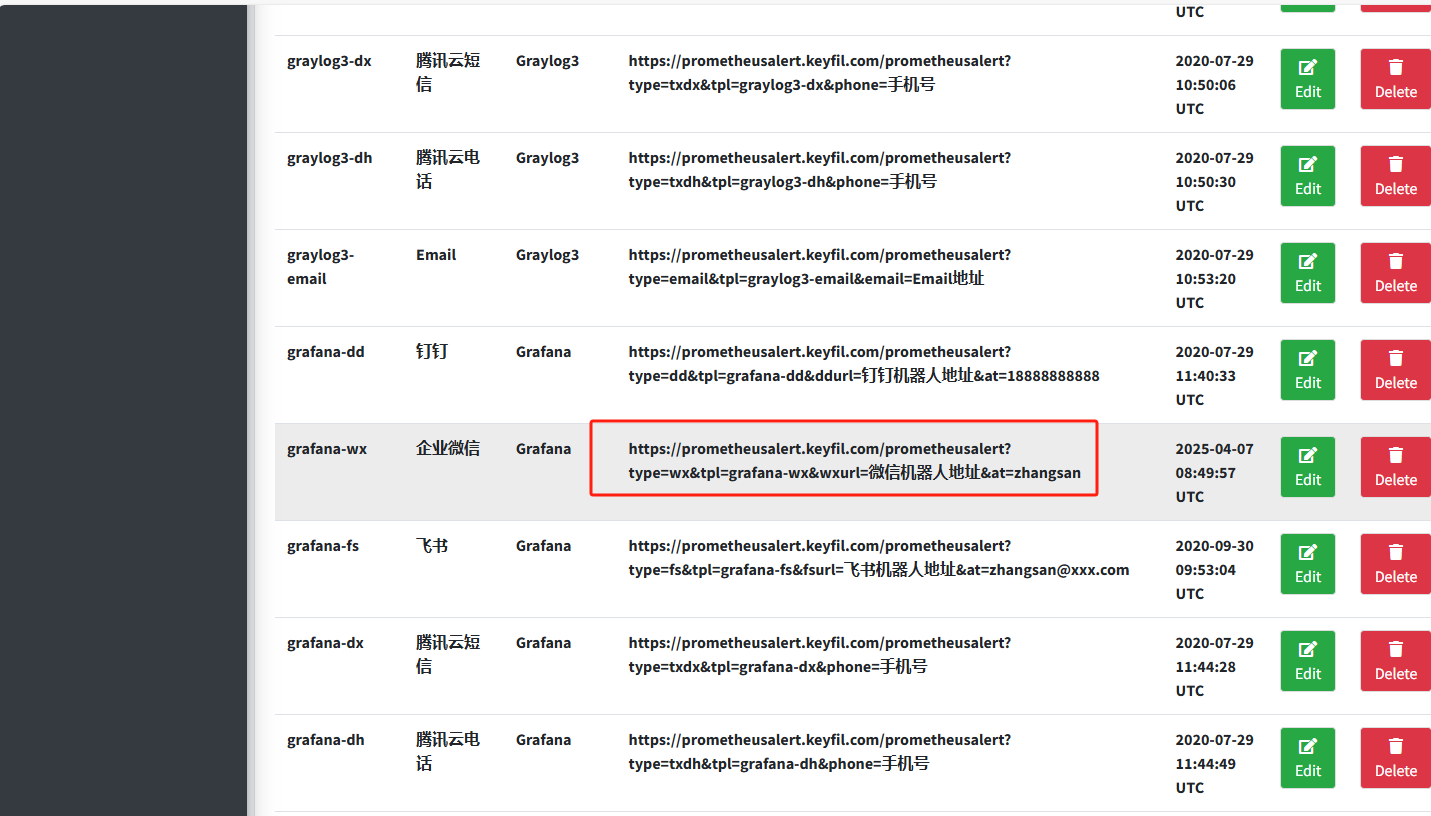
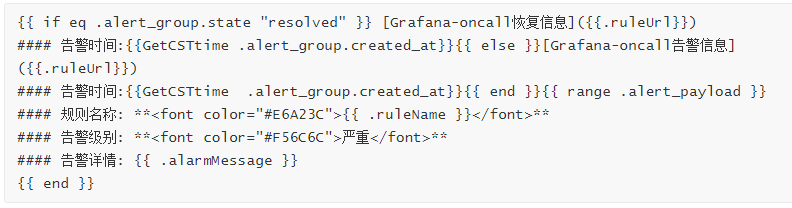
配置模板内容:
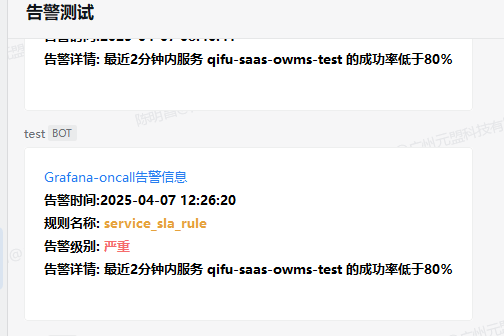
Skywalking到grafana-oncall再到企微:
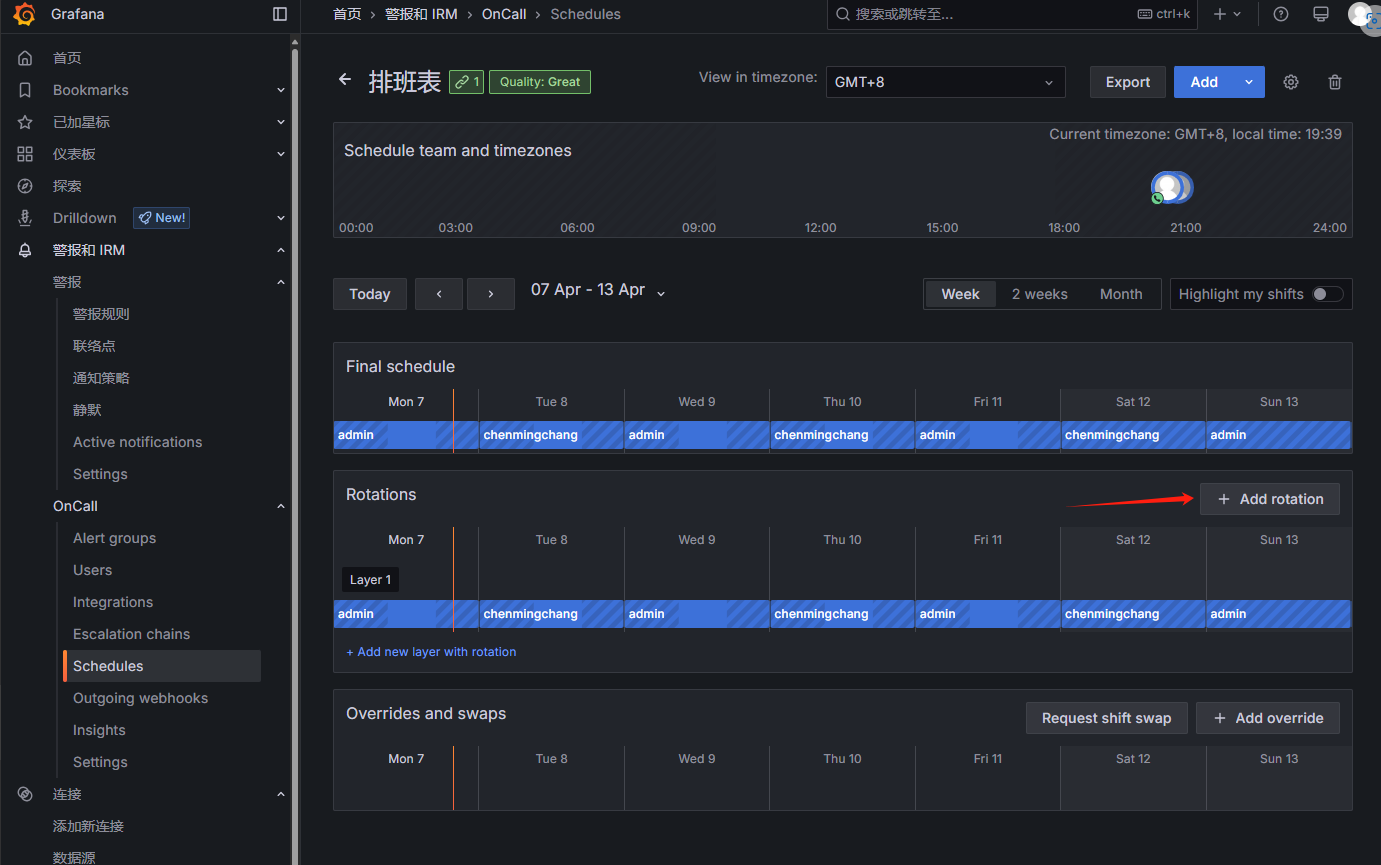
配置排班表:
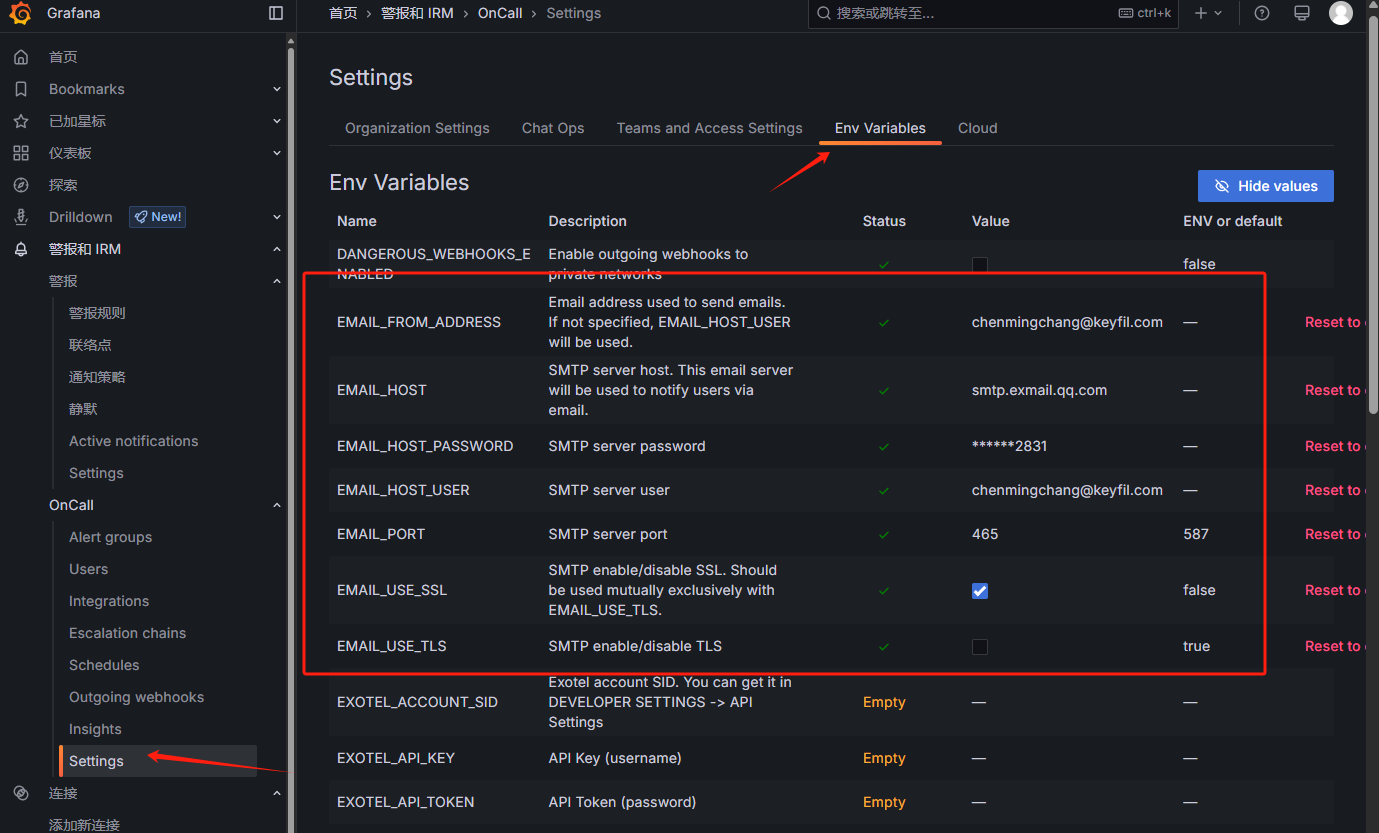
配置发送邮箱:
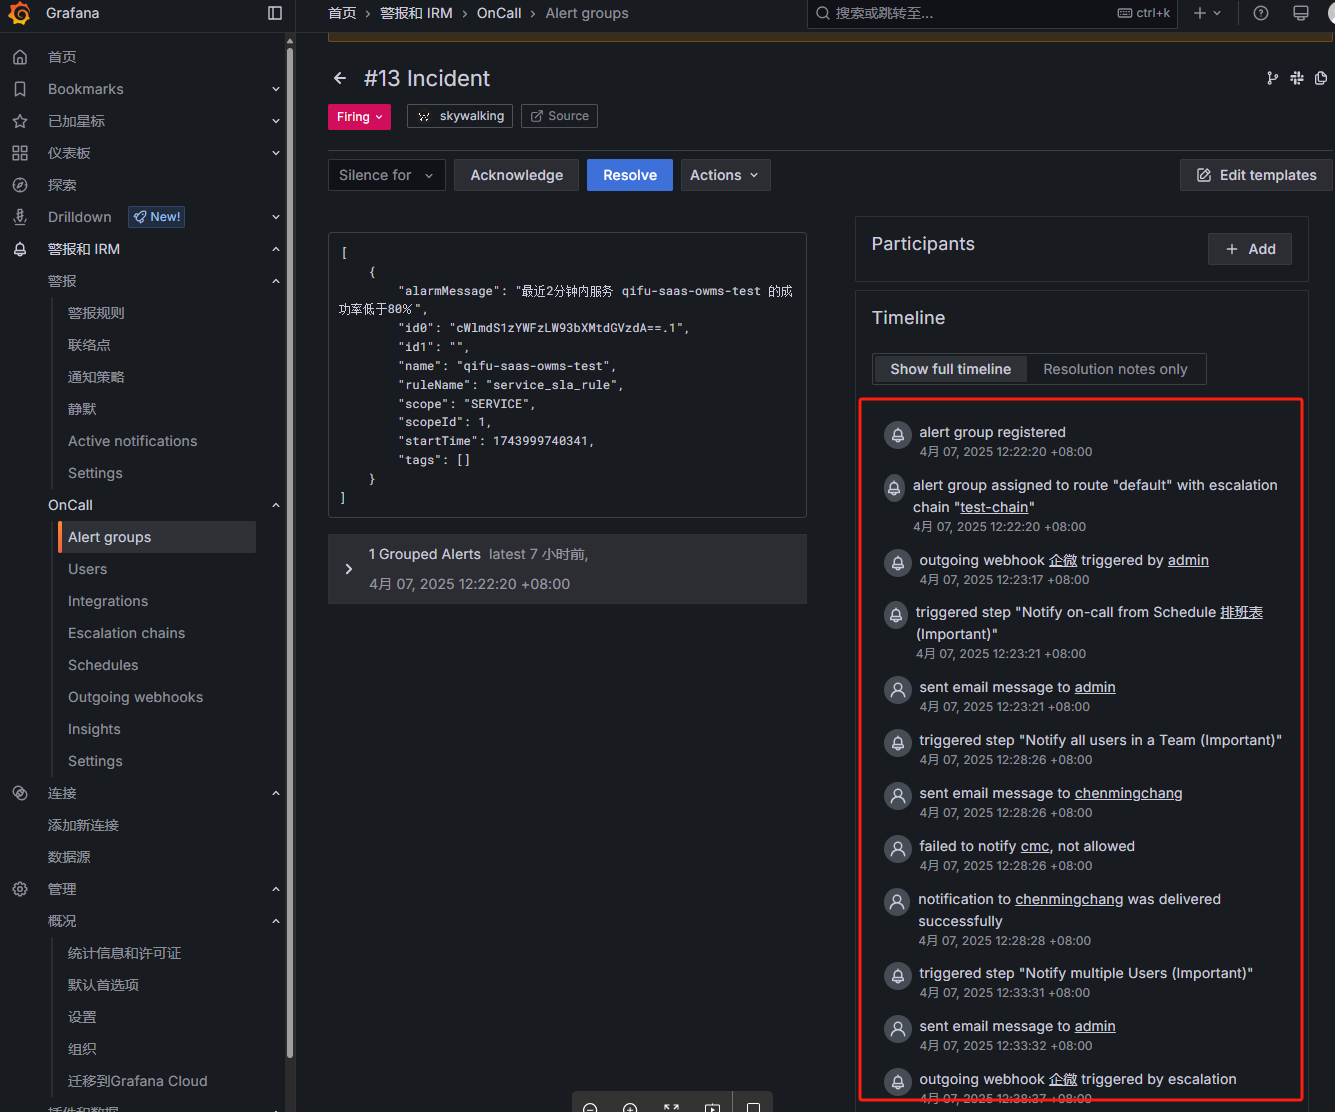
触发告警时会按照升级链的配置执行相应的步骤:
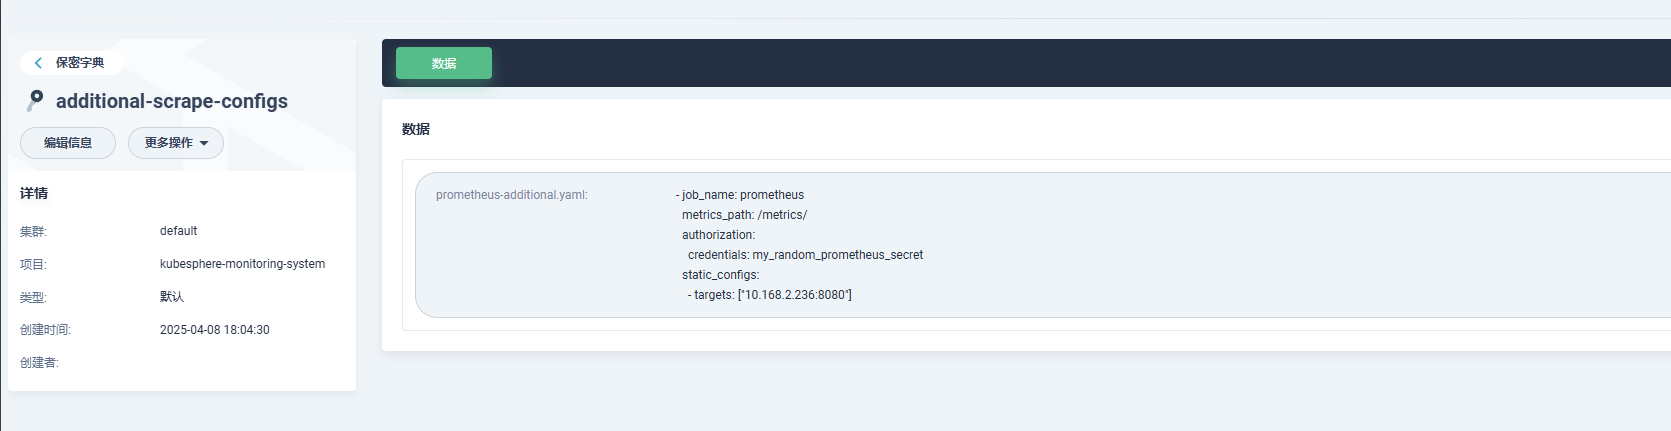
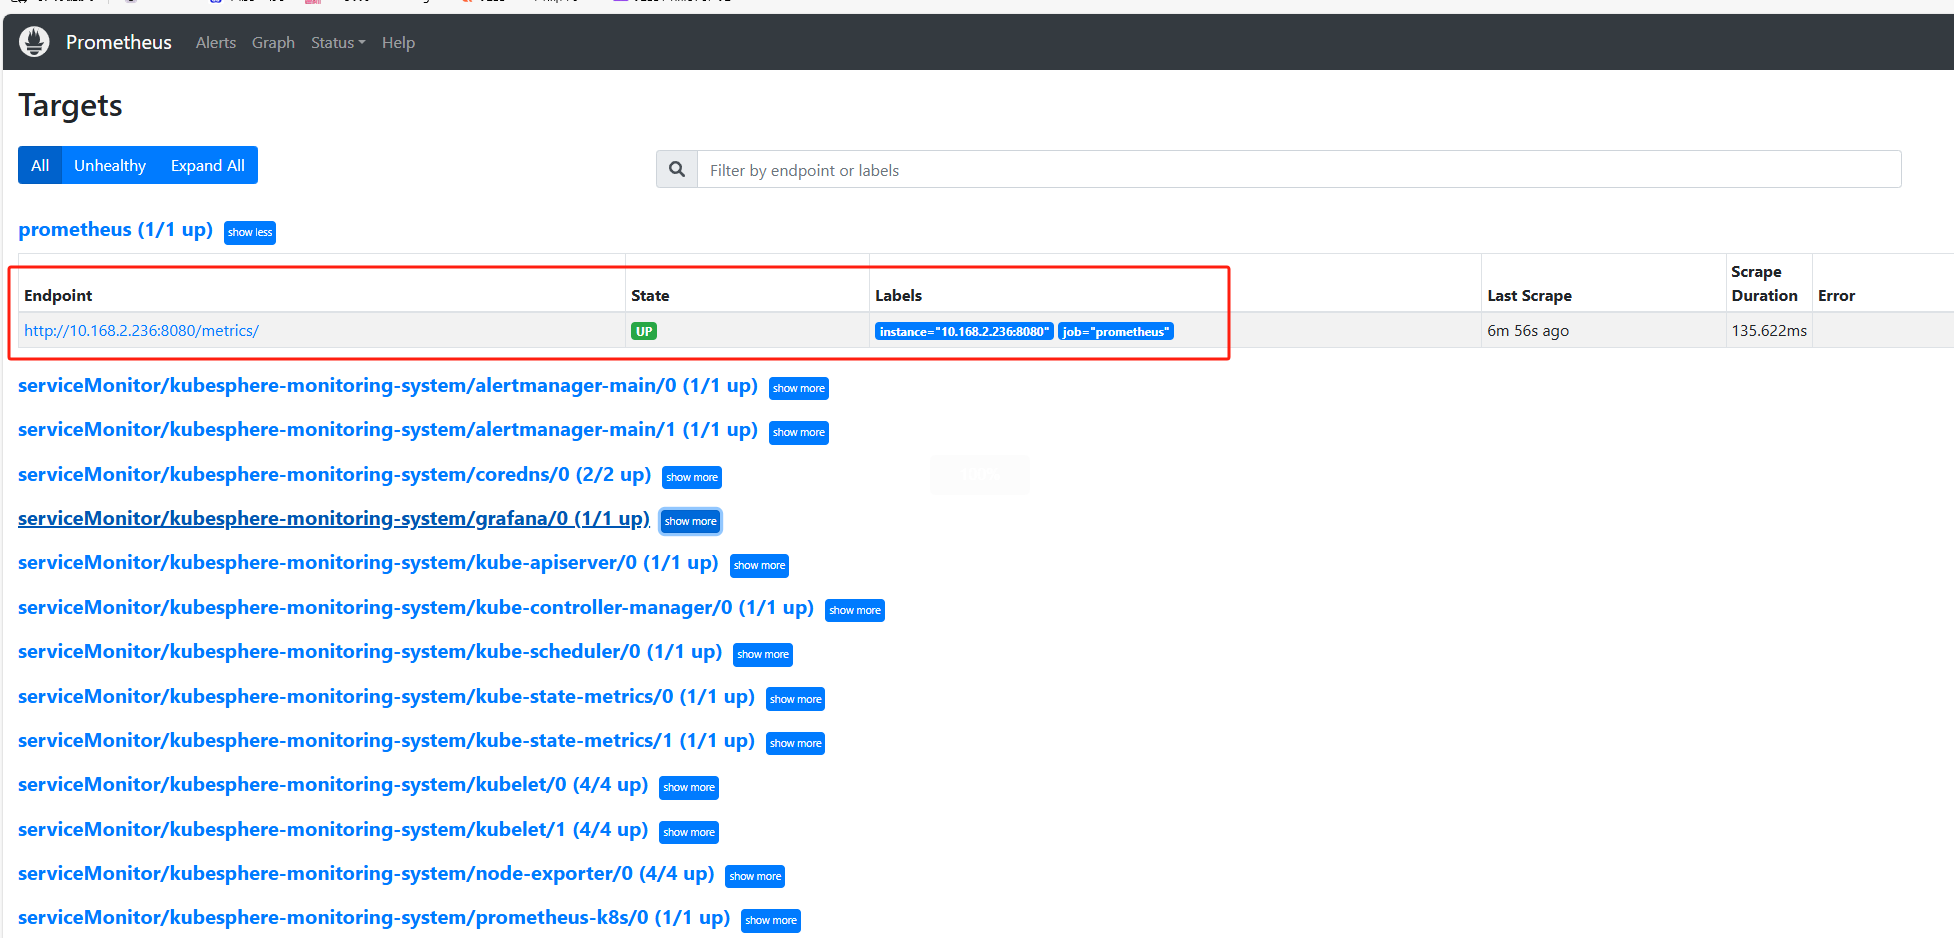
Prometheus配置文件添加指标导出:
1 | - job_name: prometheus |
通过k8s部署
需要先安装好helm
添加仓库:
1 | helm repo add grafana https://grafana.github.io/helm-charts |
安装:
1 | helm install \ |
自定义values.yaml文件,可按需修改:
1 | # Values for configuring the deployment of Grafana OnCall |
遇到的问题
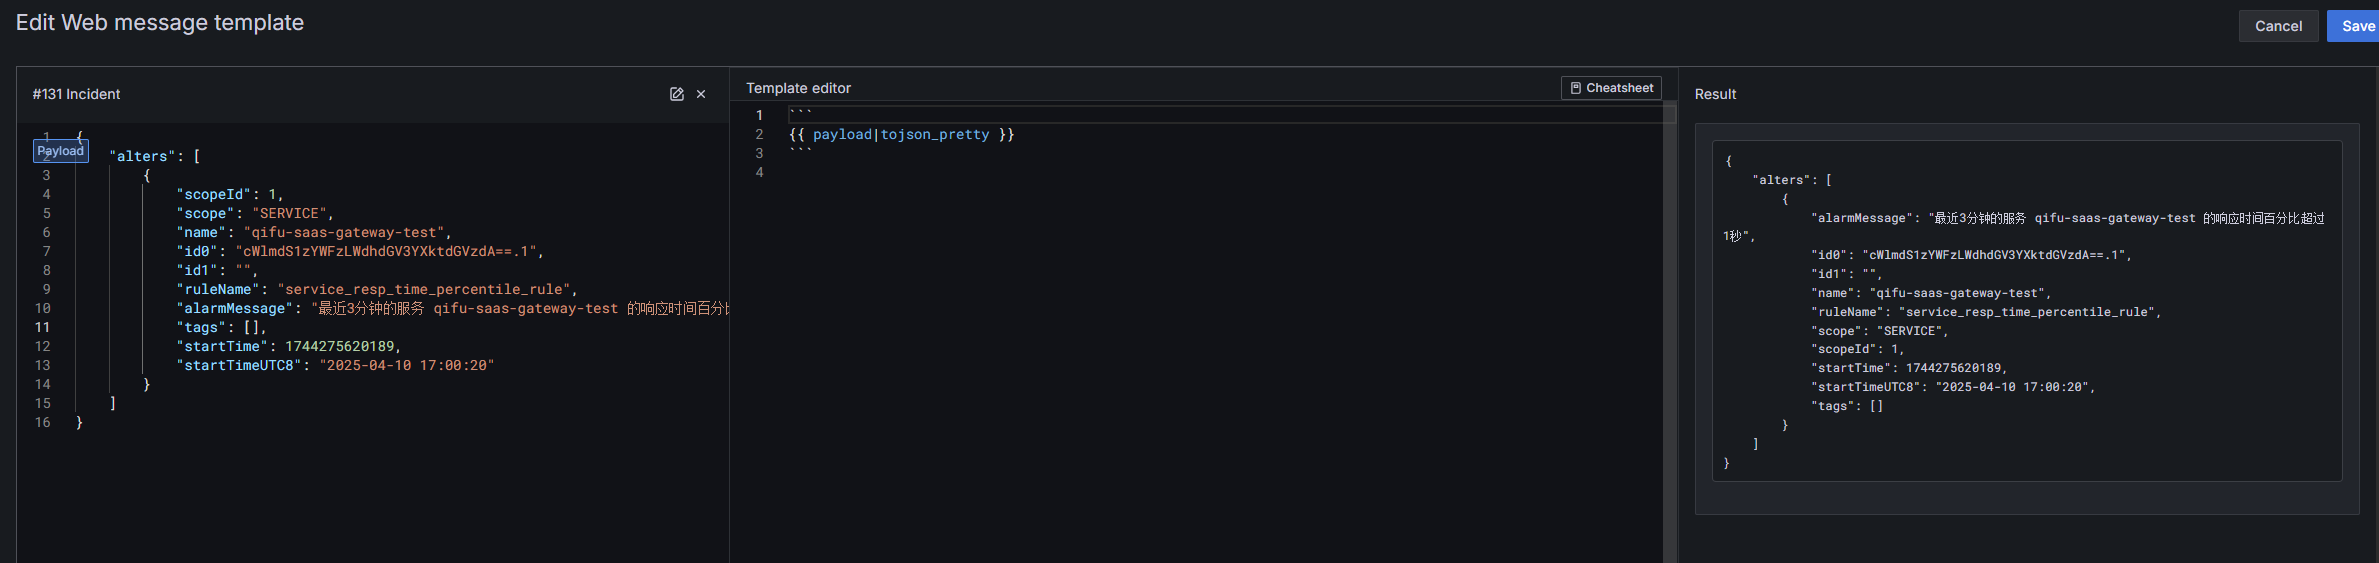
oncall模板识别payload错误
配置完之后由于Skywalking发送的payload如下:
1 | [ |
会导致template识别报错:
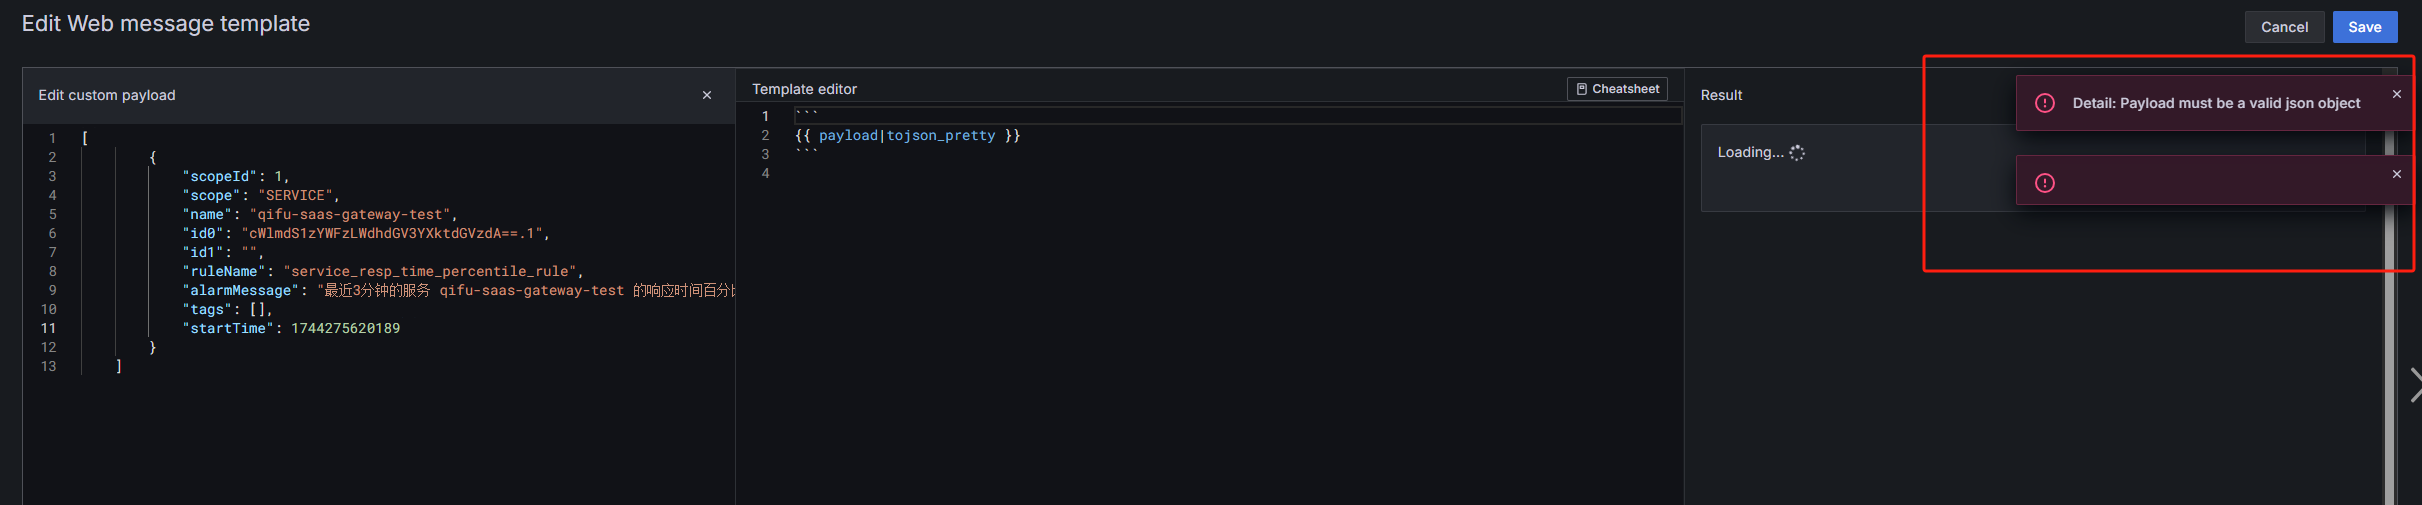
所以我用python写一个中转节点程序来格式化Skywalking原始告警payload并把告警时间戳转为CST时间,整体就是Skywalking发送告警到中转节点,格式化之后再把告警信息转发到Granfana-oncall,
skywalking-tra.py:
1 | # -*- coding: utf-8 -*- |
安装好依赖:
1 | pip3 install flask requests datetime |
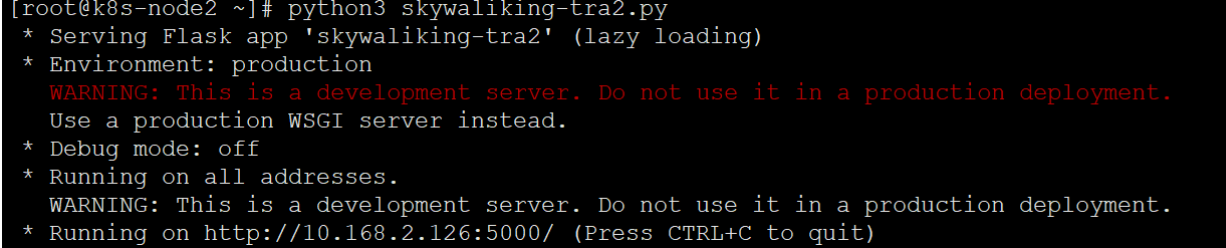
运行:
1 | python3 skywaliking-tra.py |
修改Skywalking的配置文件webhook为中转节点程序:
alarm-settings.yml:
1 | webhooks: |
重启Skywalking服务以生效。
现在的payload信息grafana-oncall可以识别了:
由于修改了payload的格式,所以对应的PrometheusAlert的模板也要修改,不然会导致识别不到字段从而发送失败
Skywalking到中转节点到grafana-oncall再到企微:
URL错误
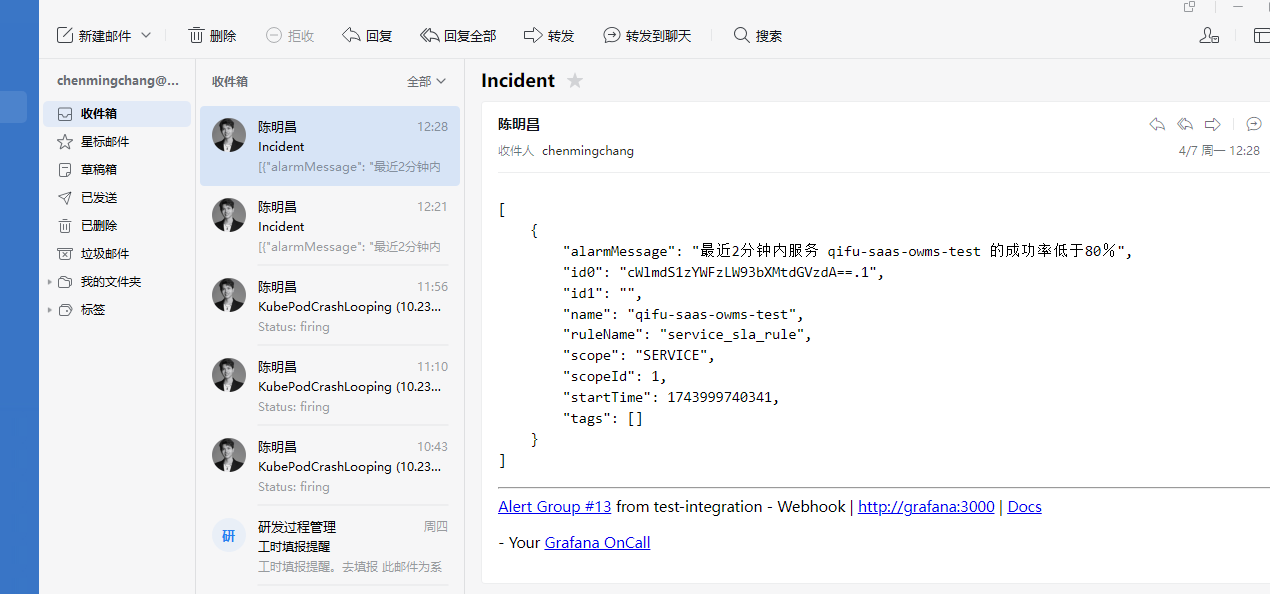
发现邮件告警的链接之前是在服务器配置的url,本地会打不开:
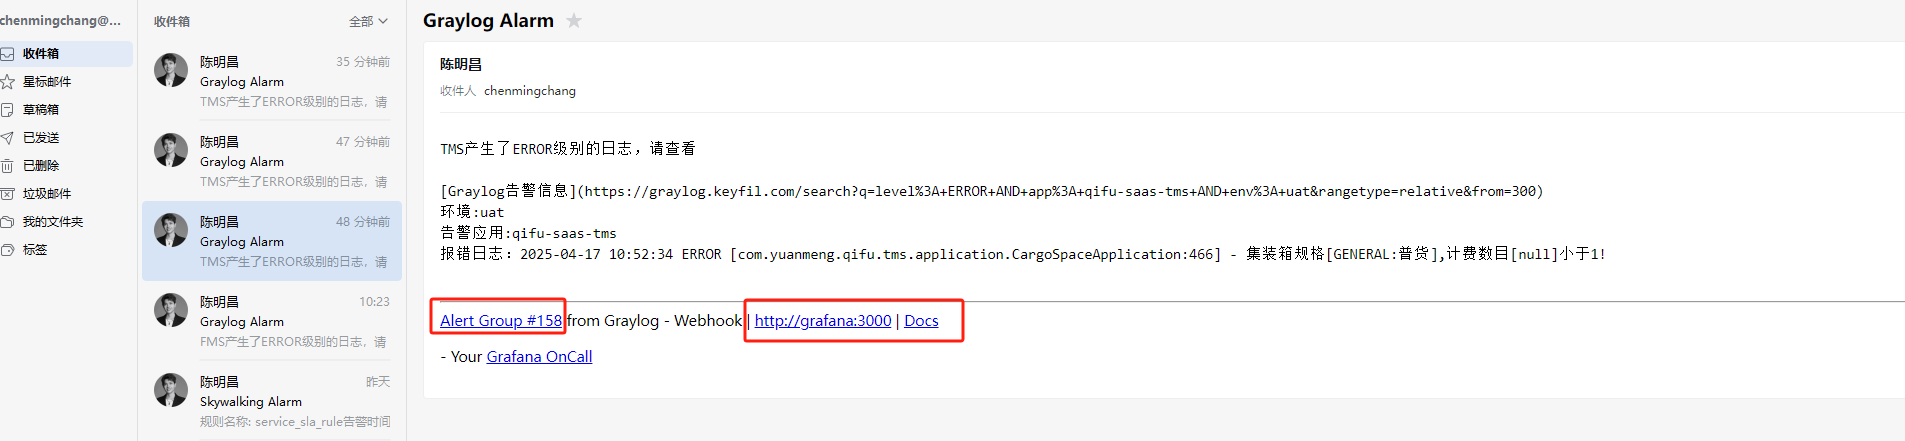
配置了Granfana-oncall的对外访问链接之后,可以修改URL为对外访问的URL:
1 | curl -X POST 'http://admin:admin@localhost:3000/api/plugins/grafana-oncall-app/settings' -H "Content-Type: application/json" -d '{"enabled":true, "jsonData":{"stackId":5, "orgId":100, "onCallApiUrl":"http://engine:8080", "grafanaUrl":"https://oncall.example.com"}}' |
个性化配置
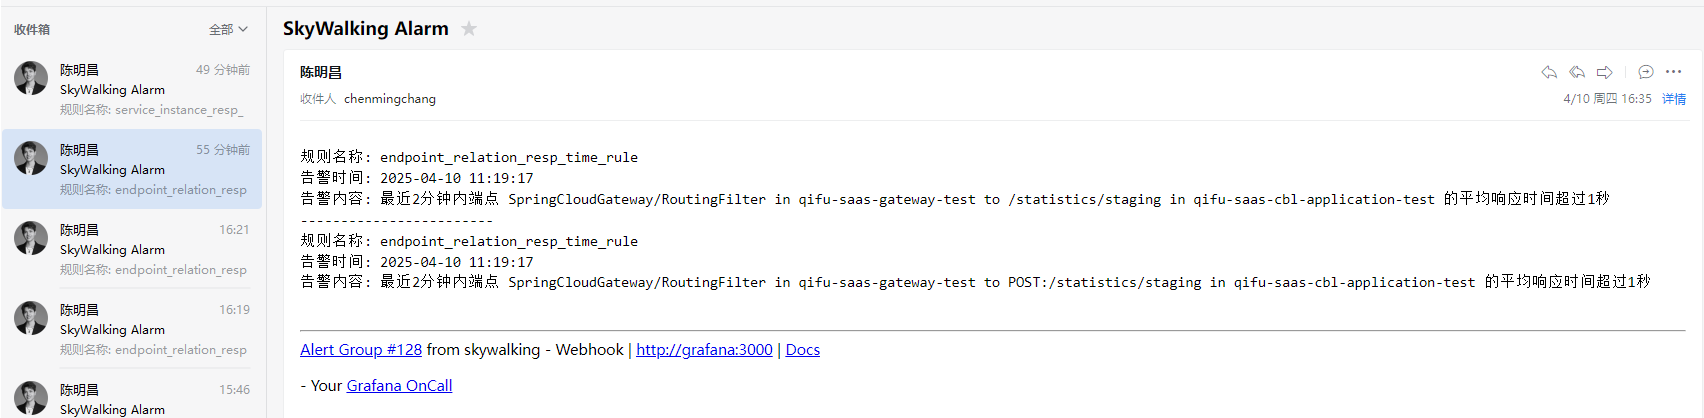
告警内容简介美化
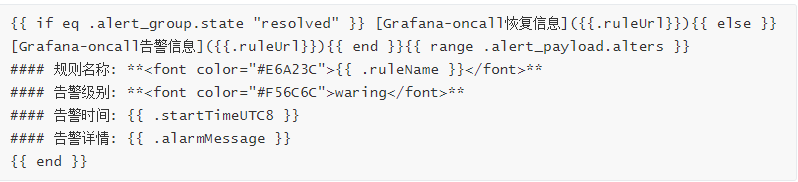
因为我们是配置了通过邮件方式发送告警给值班人员,发送的内容如下:
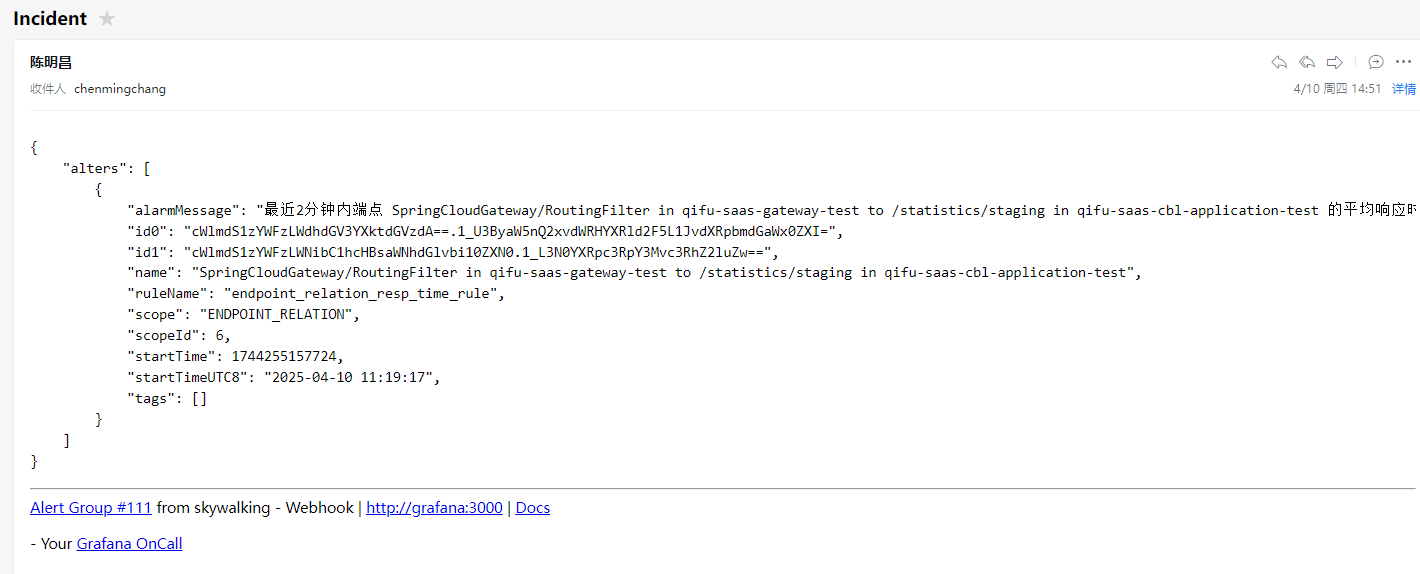
告警内容有些字段我们是不需要的,我们可以通过配置模板来实现美化简介告警内容:
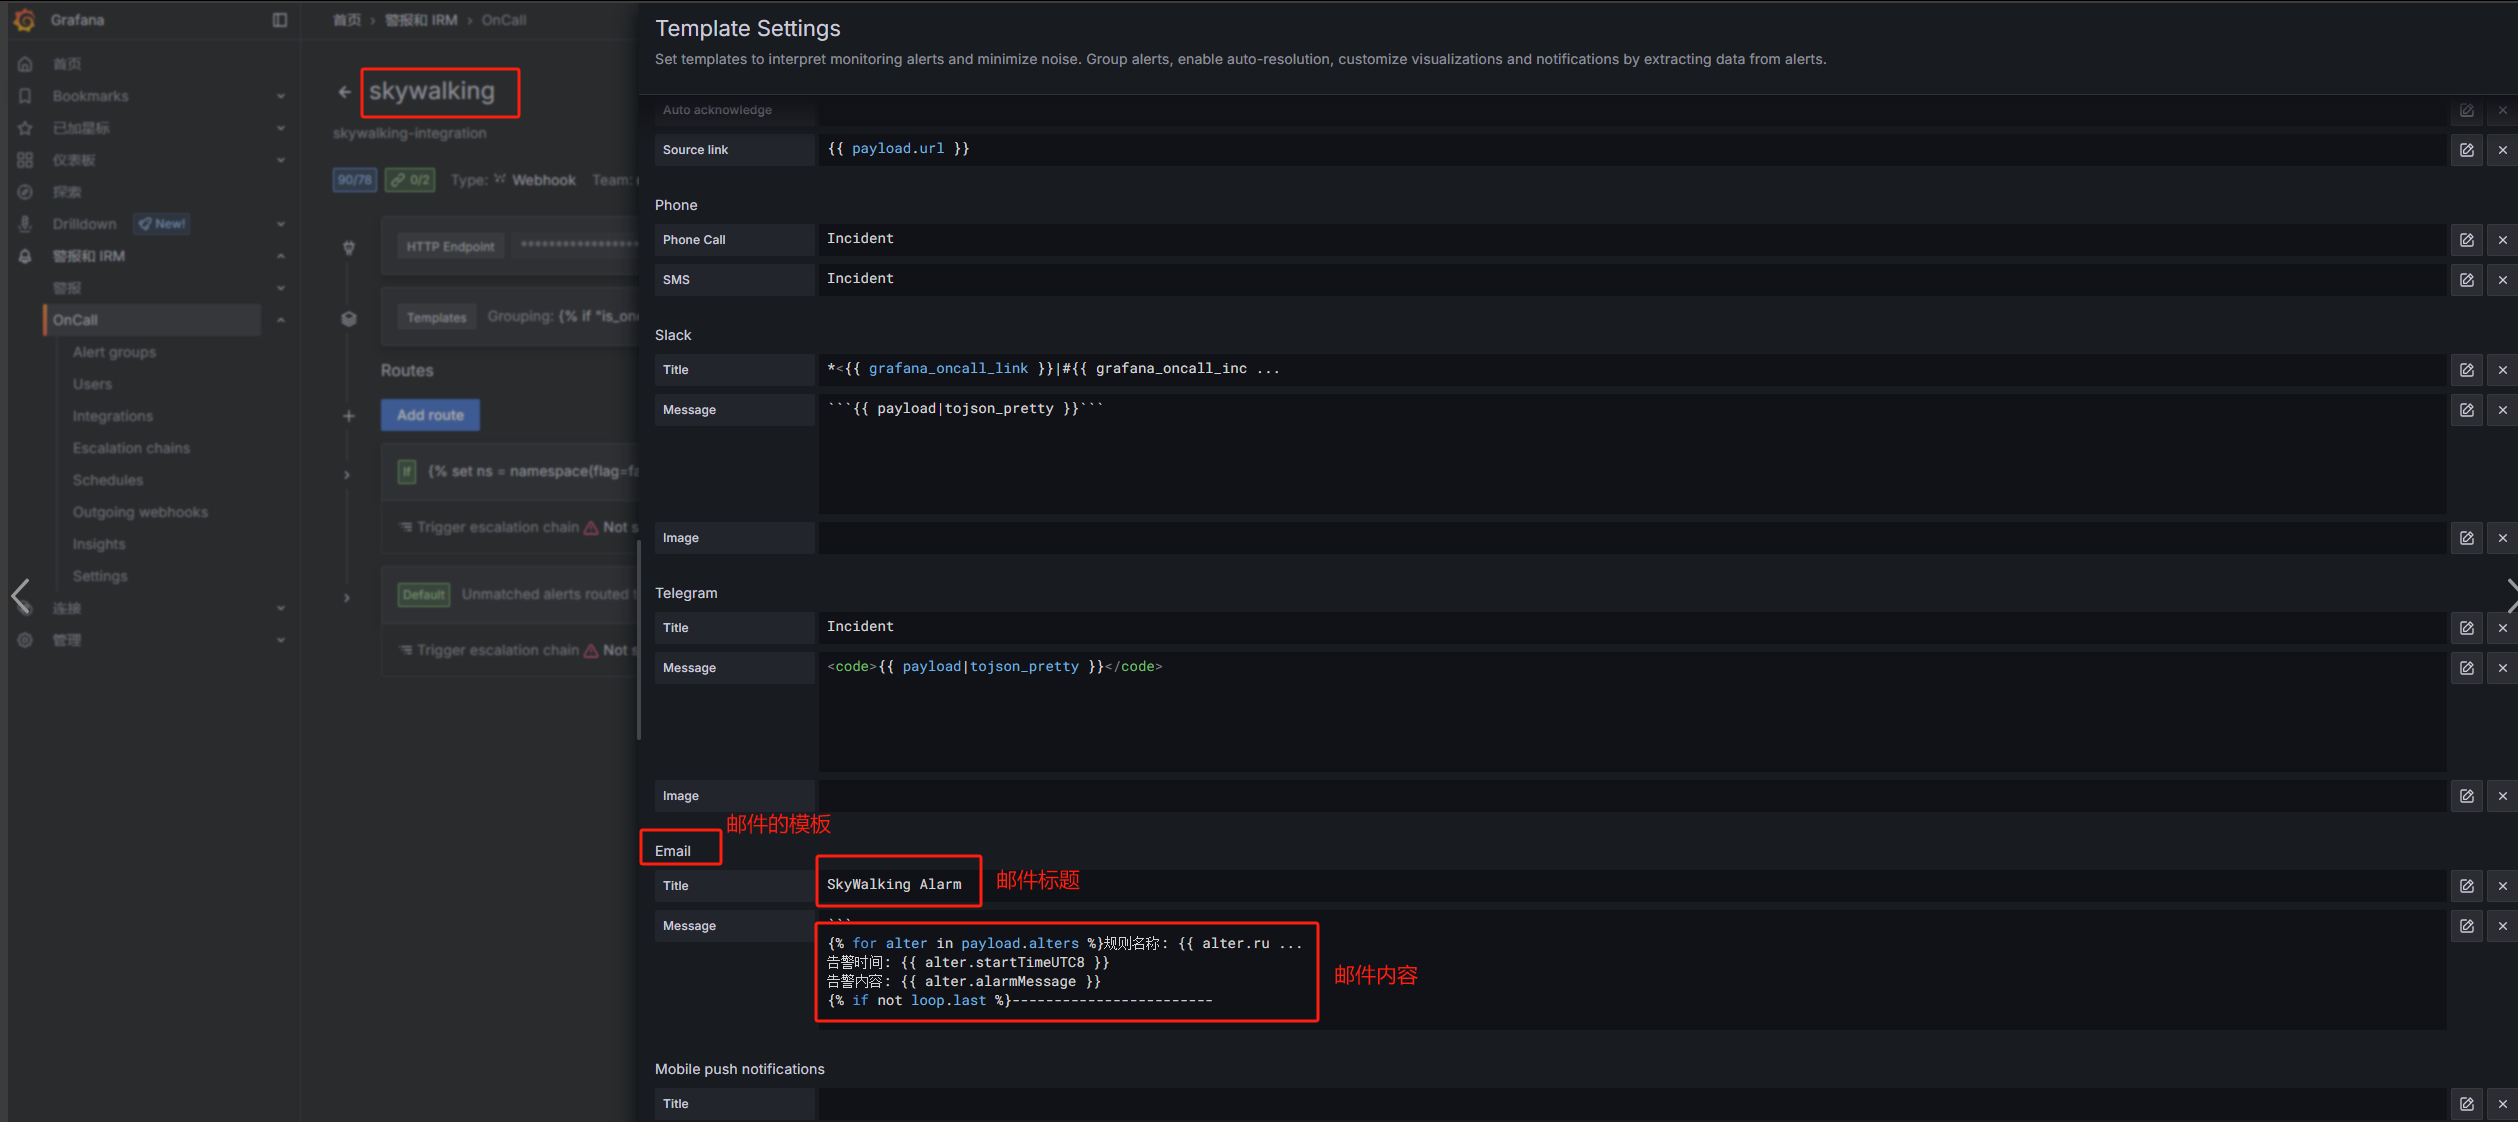
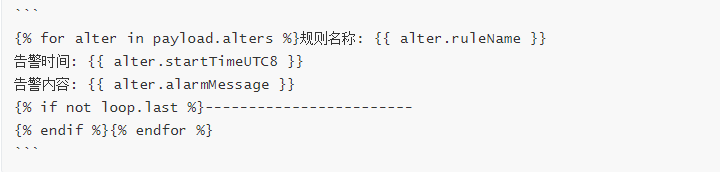
模板配置如下:
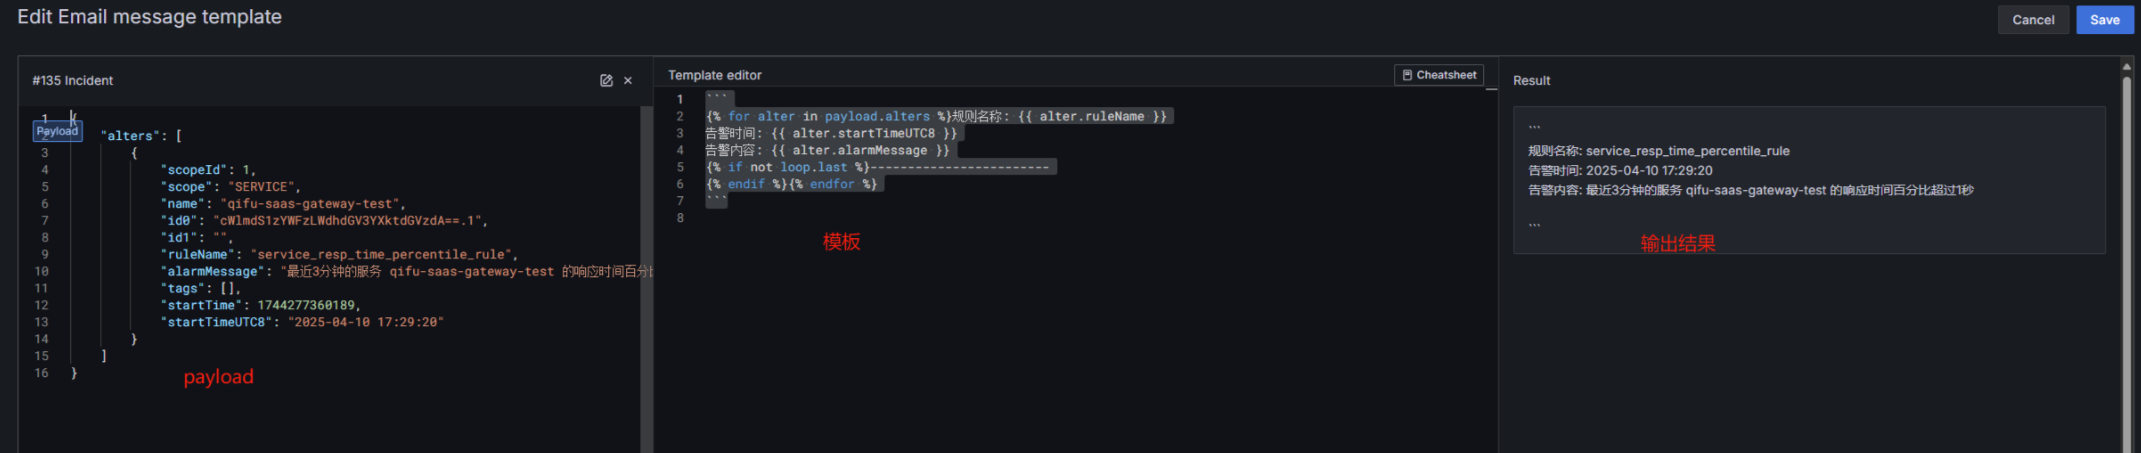
看一下效果:
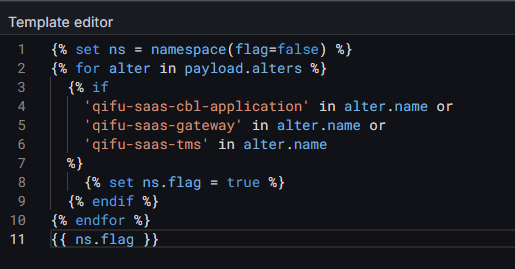
根据服务名路由告警
现在可以通过创建不同的团队,创建对应的团队的升级链,然后通过配置集成的路由来实现对应的告警发给对应的升级链:
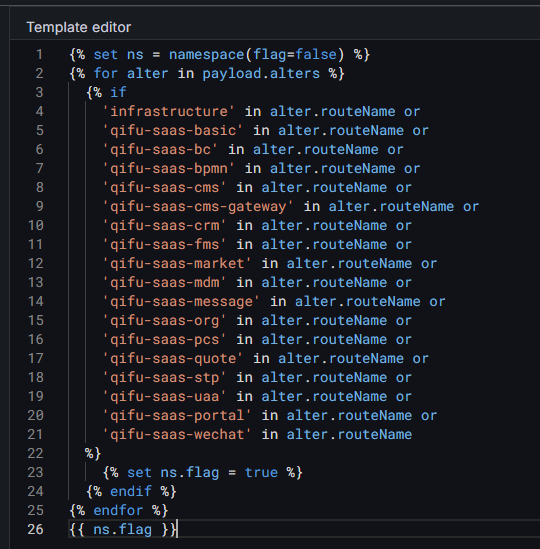
比如我配置的模板,只要payload.alters的name字段包含qifu-saas-cbl-application或qifu-saas-gateway或qifu-saas-tms就发送到ops的升级链:
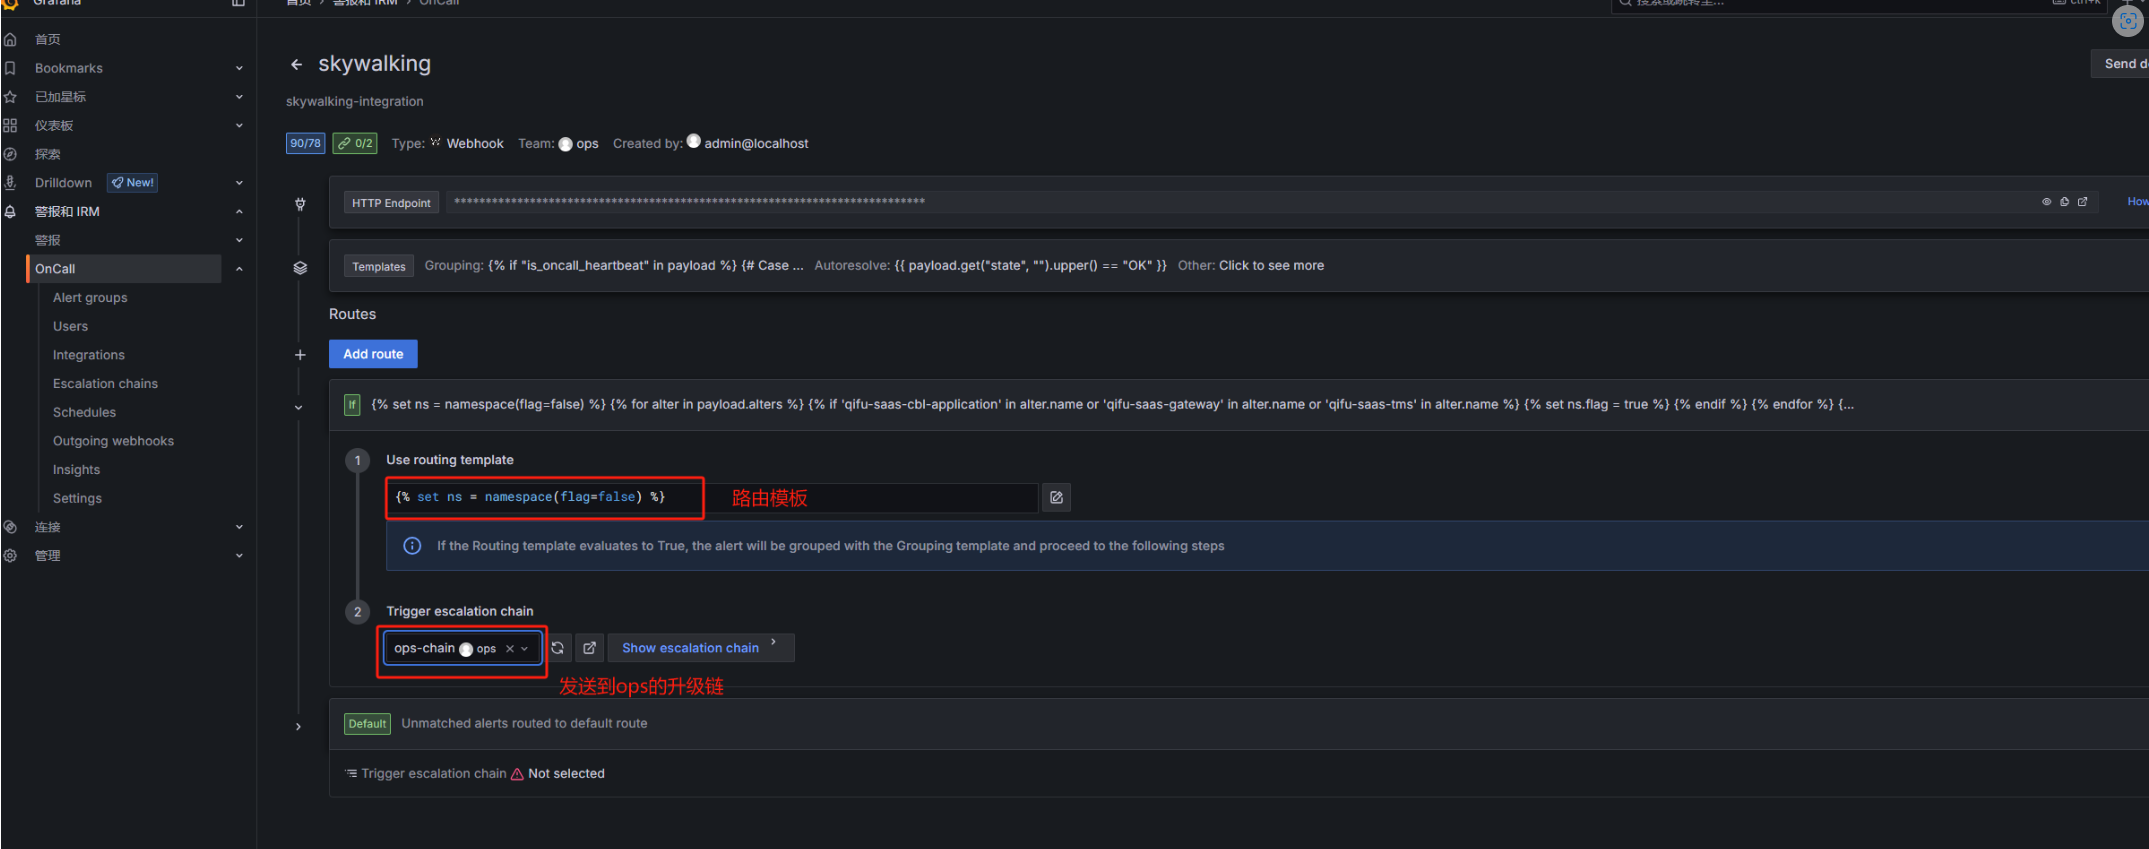
配置完效果:
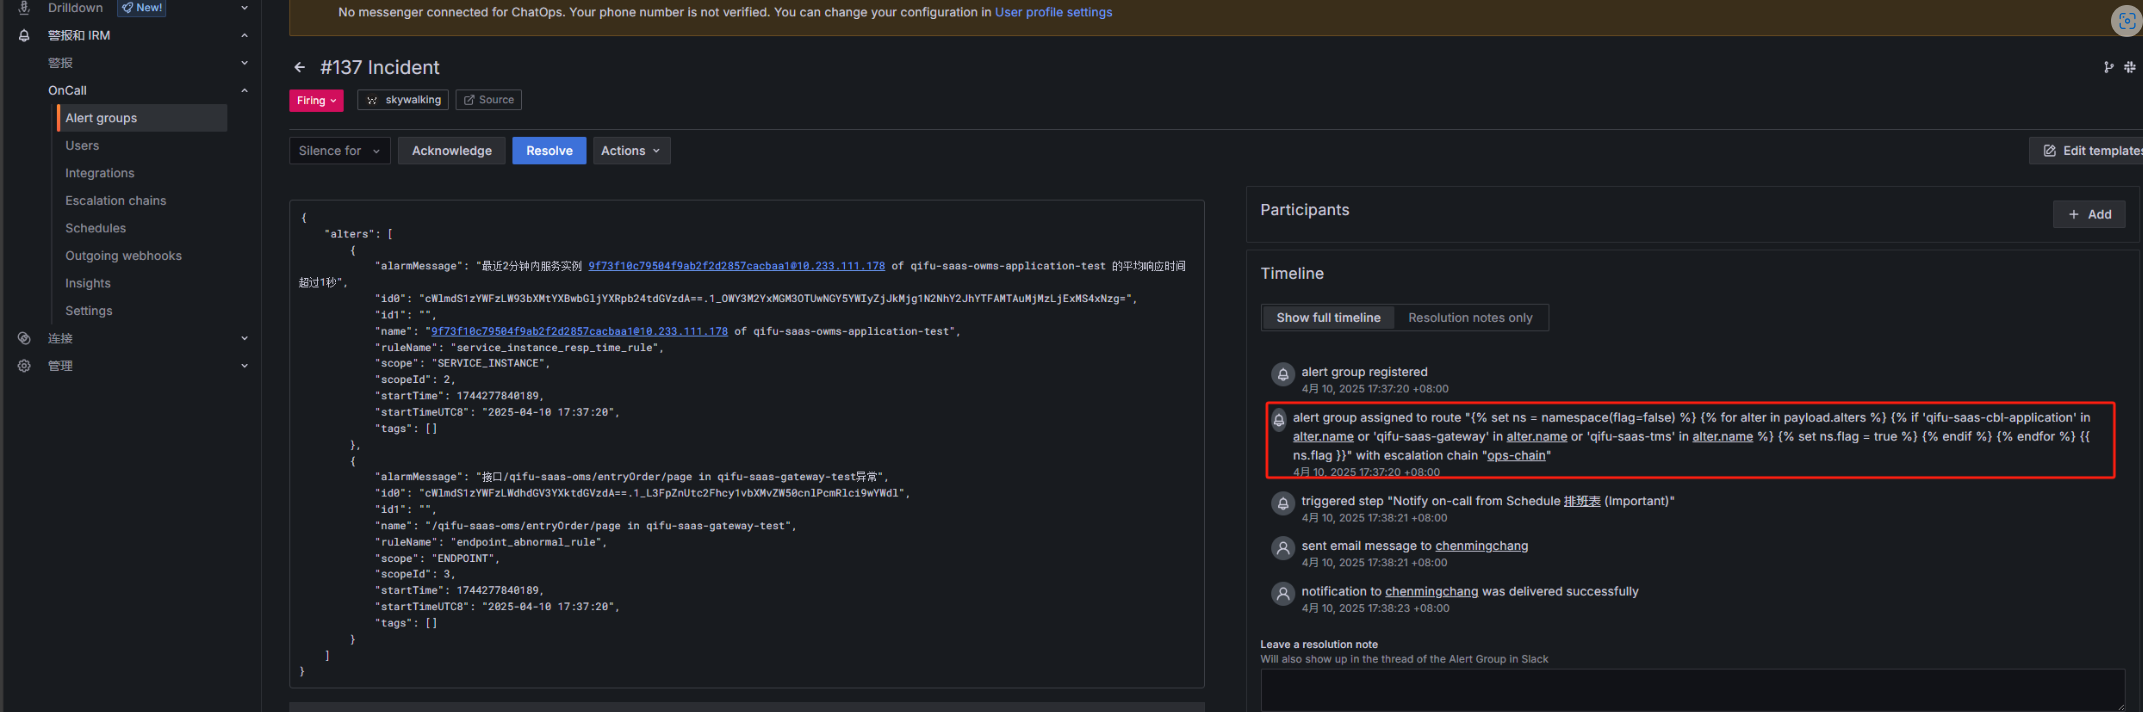
拆分告警组
skywalking默认同一条告警会包含多组告警信息:
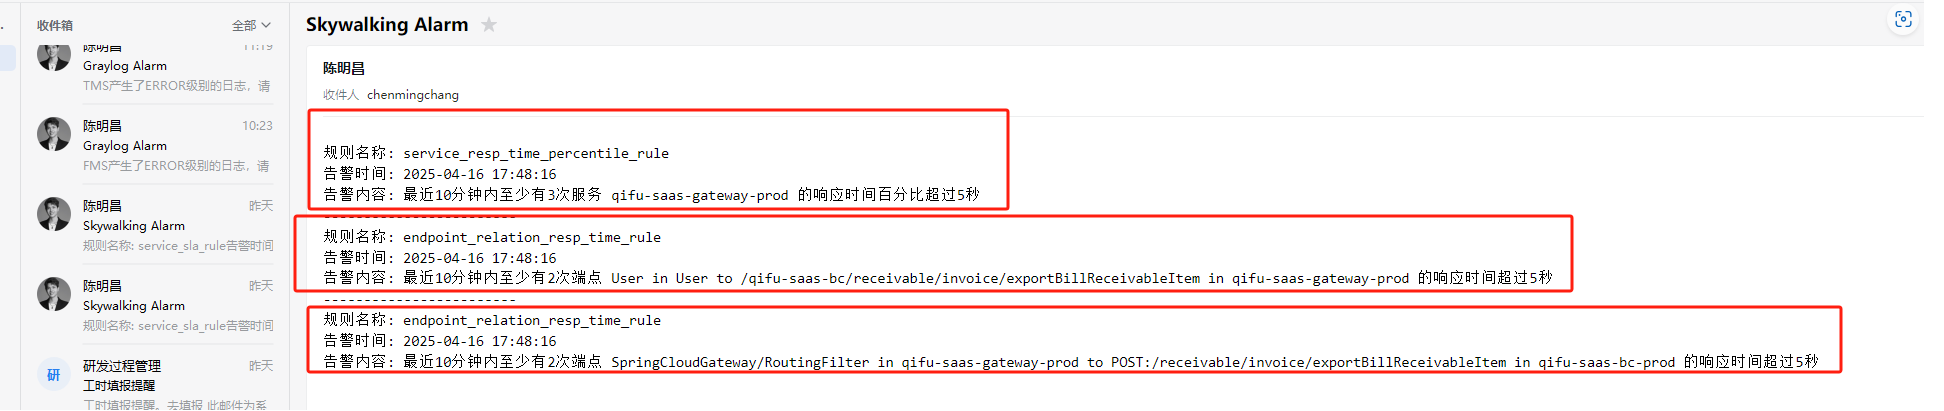
正常情况没啥问题,但是在这里我们需要根据服务名来区别,不同的人员接收到他们自己的告警信息,如果合并在同一条告警里,可能只有1组告警是需要我负责的,但是现在3组信息我都看到了,所以在这里对webhook进行改造,把告警信息进行拆分,每条告警只包含一组信息:
skywalking-tra.py:
1 | # -*- coding: utf-8 -*- |
测试告警信息是否分开发送:
1 | curl -X POST http://localhost:5000/alert -H "Content-Type: application/json" -d '[ |
优化端点类型的告警
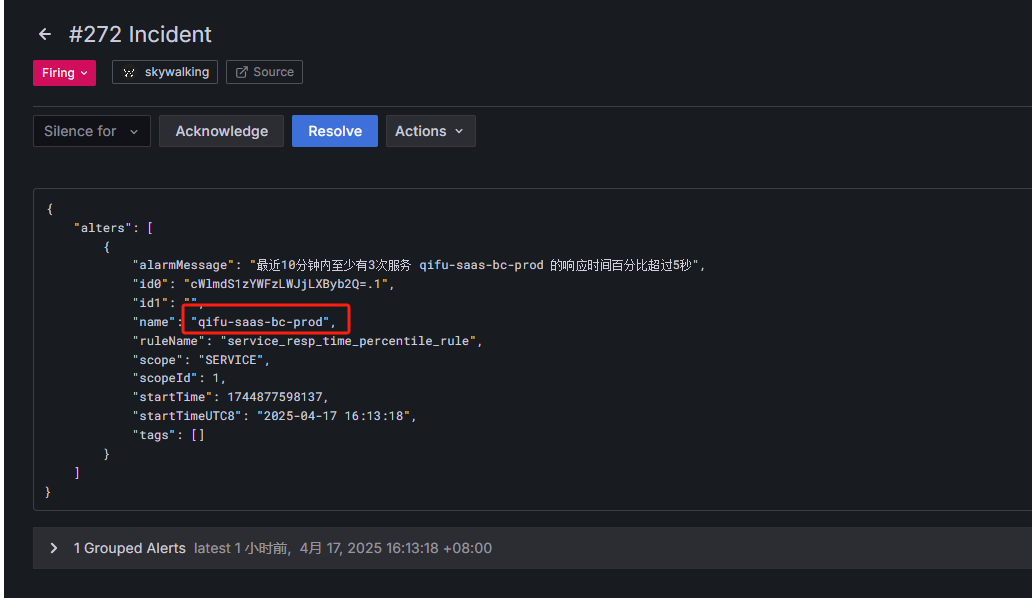
oncall平台通过skywalking告警payload的name字段的值来路由给对应的负责人员,正常的告警没有问题,会通过我们编写的路由模板来匹配给对应的升级链:
但是如果是端点类型的告警,会出现两个服务名称:
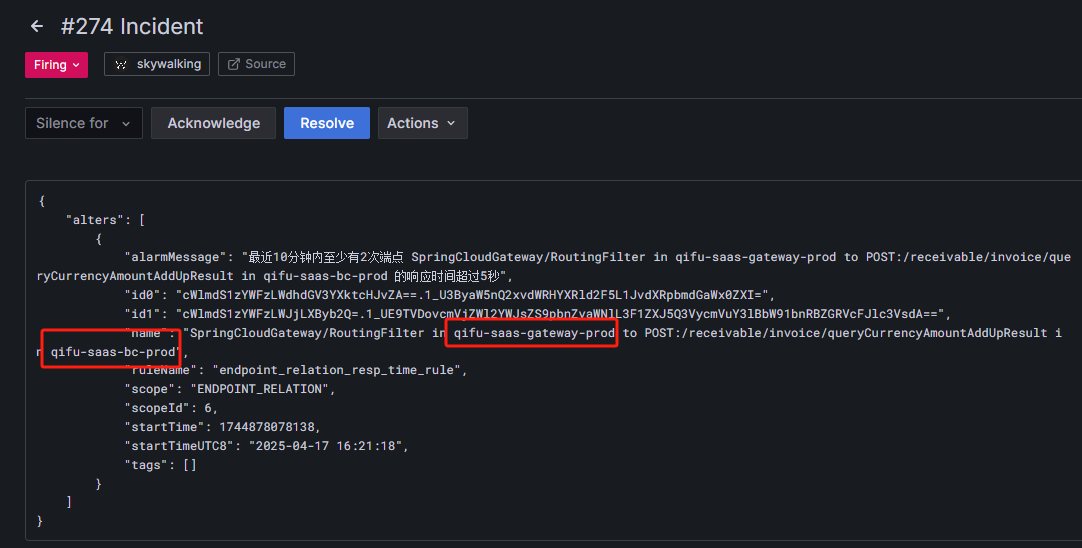
这种情况是qifu-saas-gateway服务去请求qifu-saas-bc服务的接口响应时间过长,需要告警给负责qifu-saas-bc服务的人员,所以还需要对webhook进行改造:
思路:新添加一个routeName字段,如果name字段不包含to字符,routeName就等于name,如果包含to字符(包含空格),就以in为分隔符,取最后一列:
skywalking-tra.py:
1 | # -*- coding: utf-8 -*- |
然后再修改路由模板,根据routeName来路由:
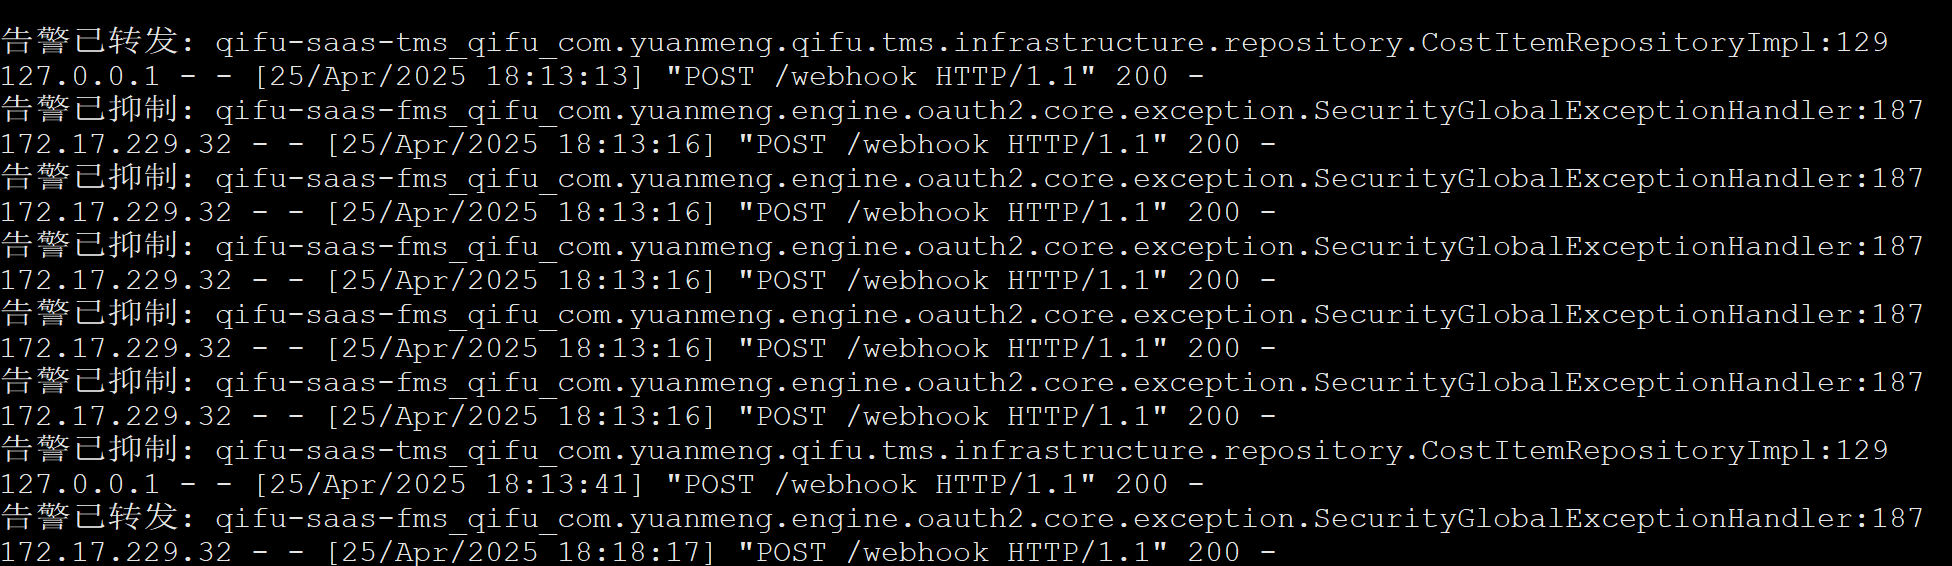
Graylog日志告警抑制
Graylog有ERROR日志的话就会触发告警,但是会有多个相同的告警频繁触发,导致告警很多,通过接入一个中转webhook对告警信息的app,namespace和message字段的类名+行号来生成一个告警ID,十分钟内如果告警ID相同的话,就不再重复发送告警:
1 | # -*- coding: utf-8 -*- |
注:
有些ERROR日志很长,通过邮箱告警的话没问题,但是如果想通过企微告警,会有长度限制(4096字节),而且消息太长也不美观,所以可以通过中转webhook,对消息进行截取:
1 | # -*- coding: utf-8 -*- |
优化跳转链接时间范围
之前的Graylog告警点击告警链接取的值是当前时间的前5分钟,如果超过了5分钟才看到告警,此时点击链接跳转就找不到对应的日志了,还得手动去调时间范围,所以再改造webhook,生成两个新的字段,取值为告警时间的前后一分钟:
1 | # -*- coding: utf-8 -*- |
Graylog的MySQL慢日志告警
添加了Graylog收集的MySQL慢日志告警,直接发送的payload还是有message过长,时间长告警链接跳转找不到对应日志得到问题,所以也通过中转webhook来处理payload,格式化为我们需要的格式之后再发送到oncall平台(添加了告警时间的前后一分钟字段,message过长截断以及处理慢日志里存在的###被Markdown解析为标题的问题):
1 | # -*- coding: utf-8 -*- |
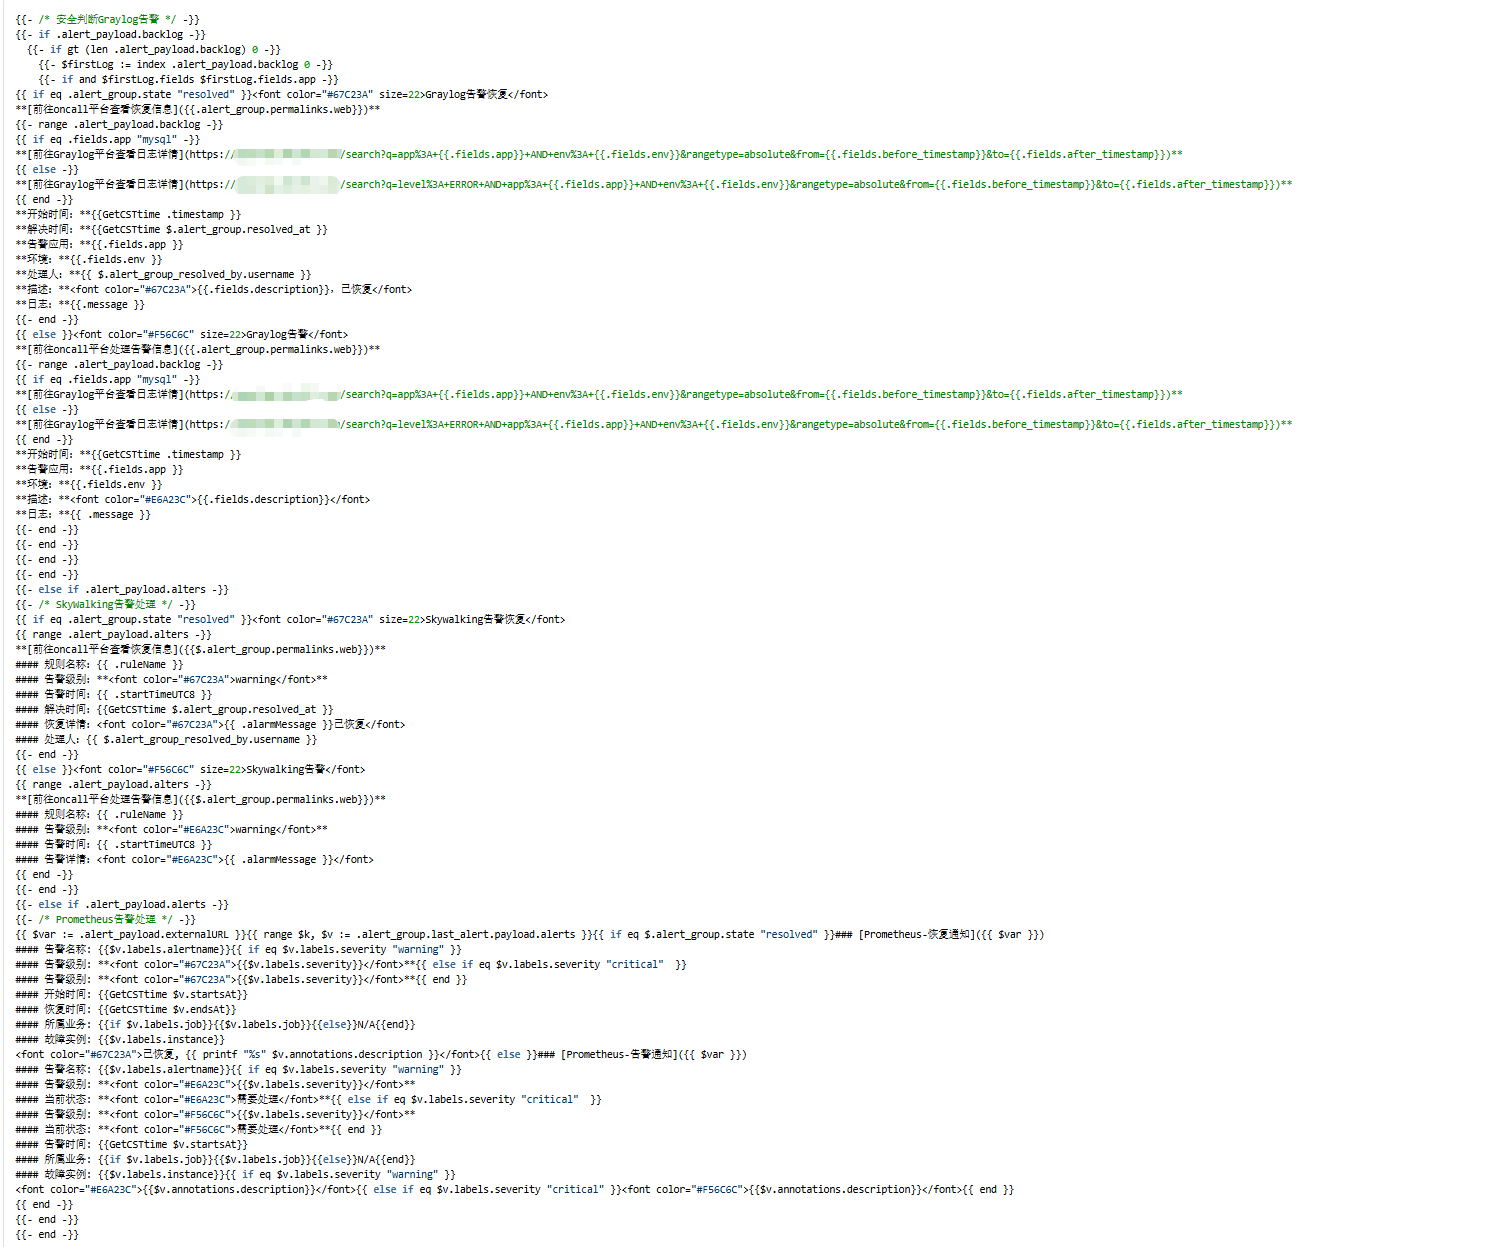
告警模板
对应的告警模板也需要需改
nohup启动日志缺失问题
通过以下命令启动:
1 | /usr/bin/python3 /usr/local/grafana-oncall/graylog-suppressed.py |
控制台的输出日志为:
通过以下命令启动:
1 | nohup bin/python3 localgraylog-suppressed.py >> localgraylog_nohup.out 2>&1 & |
graylog_nohup.out文件的内容只有:
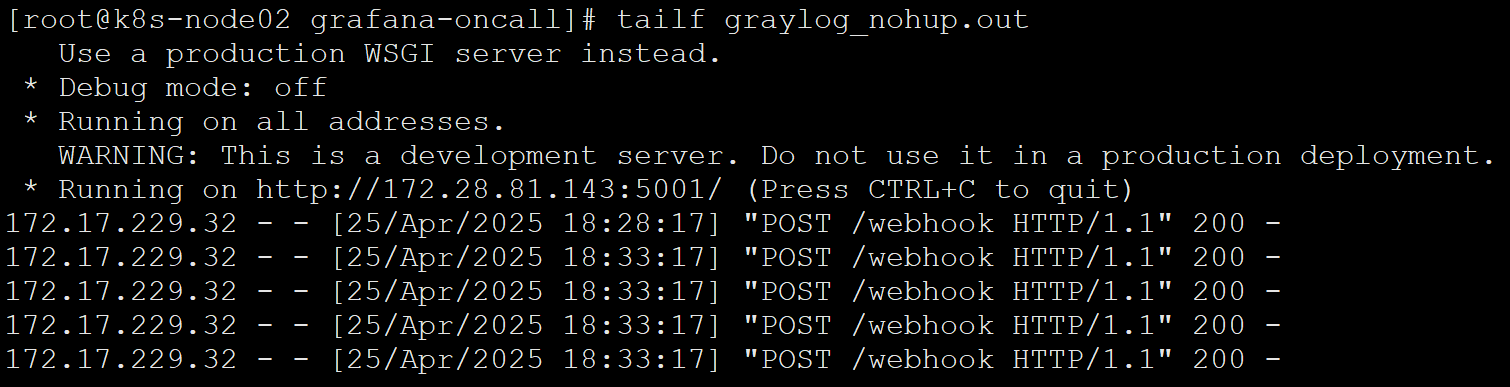
这是因为通过 nohup 后台运行时,标准输出变为块缓冲(block-buffered),默认只在缓冲区满或程序退出时才会写入文件,导致日志延迟或丢失。
解决办法:
在启动命令中添加 -u 参数,强制 Python 使用无缓冲模式:
1 | nohup bin/python3 -u localgraylog-suppressed.py >> localgraylog_nohup.out 2>&1 & |